Australian researchers have just presented work that documents the “most extreme” rogue wave on record.
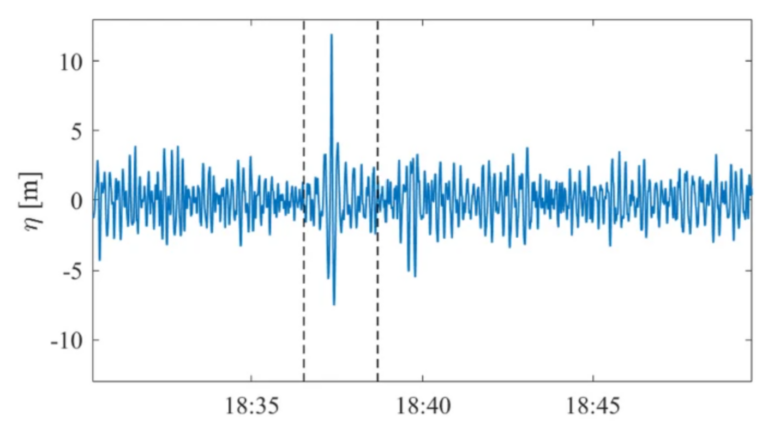
Canadian researchers from the University of Victoria have just published the results of a study carried out in November 2020. In this work spotted by Futura, they claim to have identified the rogue wave the “more extreme” never documented; Indeed, this gigantic mass of water spotted by a sensor from the firm MarineLabs in British Columbia, Canada, rose up to 17.6 meters high, more than three times the average height of the surrounding waves.
The “rogue waves”, or rogue waves in French, are among the rare elements likely to make a very experienced old sea dog grit his teeth. Indeed, these waves are as sudden as they are unusually high. The traditional definition considers that such a wave must be significantly higher than the average of the surrounding waves (we speak of the H/h ratio). For a wave to be considered as “rogue, this H/h ratio must be greater than 2.1; the wave in question must therefore be at least 2 (or rather 2.1) times higher than its neighbors.
In practice, these are real walls of water that almost look like tsunamis. However, they have several critical differences. It should be noted above all that these waves do not result from an earthquake and do not generate movements of water at depth. But that does not prevent them from representing an extreme danger for ships; even the most seasoned sailors cannot anticipate these waves sometimes described as “killer”.
A giant wave off #Ucluelet is the most extreme rogue wave ever recorded, says a group of #YYJ scientists.
Here’s the @timescolonist story by @darronkloster: https://t.co/52l1NFwEmT
The 17.6-metre swell — as high as a four-storey building — was recorded with sensor buoys 🌊 👇🏼 pic.twitter.com/Kcj2VU6BSI
— Alanna Kelly (@AlannaKellyNews) February 8, 2022
Extremely dangerous “walls of water”
Indeed, a monster of nearly 20 meters like the one spotted by Canadian researchers can easily capsize a boat if it hits it from the side. And if she surprises him from the front or the back, in rare cases, the boat can end up being lifted simultaneously from both ends without support in the center. This creates terrible mechanical stress that can break the boat like a twig.
And yet, it wasn’t even the tallest rogue wave ever seen. That honor goes to a monstrous wave spotted by the USS Ramapo, an American tanker, in 1933; the crew must have believed in the end of the world when they found themselves face to face with a liquid wall 34 meters high. Unfortunately, no scientific sensor could keep track of the event.
To find the highest rogue wave to have been strictly documented, it takes a leap of several decades to arrive at January 1, 1995, the date of the famous New Year’s Wave. It is sometimes called the Draupner Wave, from the name of the platform Norwegian oil company that she hit from the top of her 25.6 meters. But unlike the previous one, this one could be recorded by scientific sensors.
Not the highest, but the most extreme
The provision of these measurements to the scientific community has enabled numerous studies, and rogue waves are now much better known. But despite the identification of many striking examples since the Draupner wave, the one spotted by Canadian researchers stands out for its extreme H/H ratio, estimated at around 2.9. This is simply the highest ratio ever documented, and therefore the “most extreme” rogue wave ever observed. “Proportionally, the Ucluelet wave is likely the most extreme rogue wave on record”says Johannes Gemmrich, lead author of the study.
Beyond this record, these data have helped to feed a database which nevertheless remains quite meager; indeed, these are very rare events that are difficult to catch in the act. These waves are therefore still poorly understood, with all that this implies for the safety of boats. “The unpredictability of rogue waves, and the sheer power of these walls of water can make them incredibly dangerous to the navy and the general public”says Scott Beaty, CEO of Marine Labs, the company whose sensor spotted the wave.
“The question of whether it is possible to predict them remains open”, he laments. But MarineLabs does not despair of achieving this, and will soon install several dozen additional measurement stations. “These data help us better understand when, where, and how they form, as well as the risk they pose.”concludes Beaty.