It must be borne in mind that in these lines we are focusing on a program that is part of the popular Office suite, and that focuses on working with texts. It is true that it has several tools that allow us to carry out many other tasks, so knowing them all is complicated. In fact, on certain occasions we can find that this text editor allows us to carry out certain Projects which at first seemed unimaginable.
This is precisely the case that concerns us along these same lines. Specifically, we are going to show you the easiest way to create a custom graph from a table. Obviously all this without the need to use elements external to the editor itself of texts from Microsoft.
Create a data table in Word
As you can imagine, this opens up a wide range of possibilities to get the most out of the application without having to use other office applications such as Excel. Directly in the text editor we will have the possibility to create and manage our own tables and also design a chart from them.
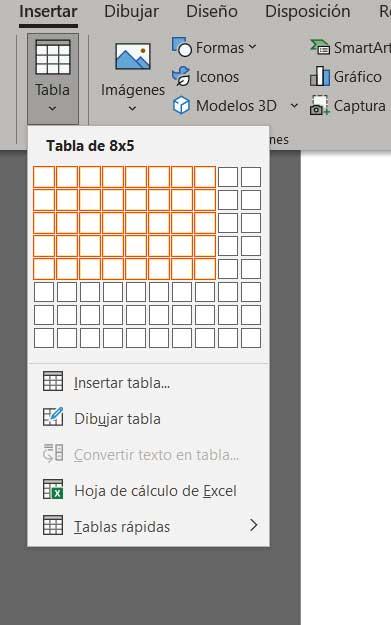
For all this that we tell you, it is evident that the first thing we will do is create the new table content with its corresponding data. This is something that we achieve directly from the Insert / Table menu option today where we will have the opportunity to customize the size and appearance of it.
Next, once we have the design on the screen, we can begin to enter the corresponding data belonging to it in its cells. Once we have finished this process of entering data, normally numerical, we are going to create a representative graph from all this. In addition, with this graph that we are discussing, we were able to show the data in a much more visual and understandable and discard the table element which can sometimes be messy.
Design a custom chart
To achieve this that we are telling you, we only have to mark all the cells of the table as such with the mouse pointer. Next, we are in the menu option called Insert, and on the right side of the options bar we find the entry called Objectwhere we click A large number of options will appear on the screen in the form of objects that we can insert into the document in which we are working.
This means that in the case that concerns us now we will have to opt for the option that reads Microsoft Graph. This will automatically create a graph based on the data that makes up the table in the format that we select. Here we can choose between several types of graphs, common in office solutions from Microsoft.
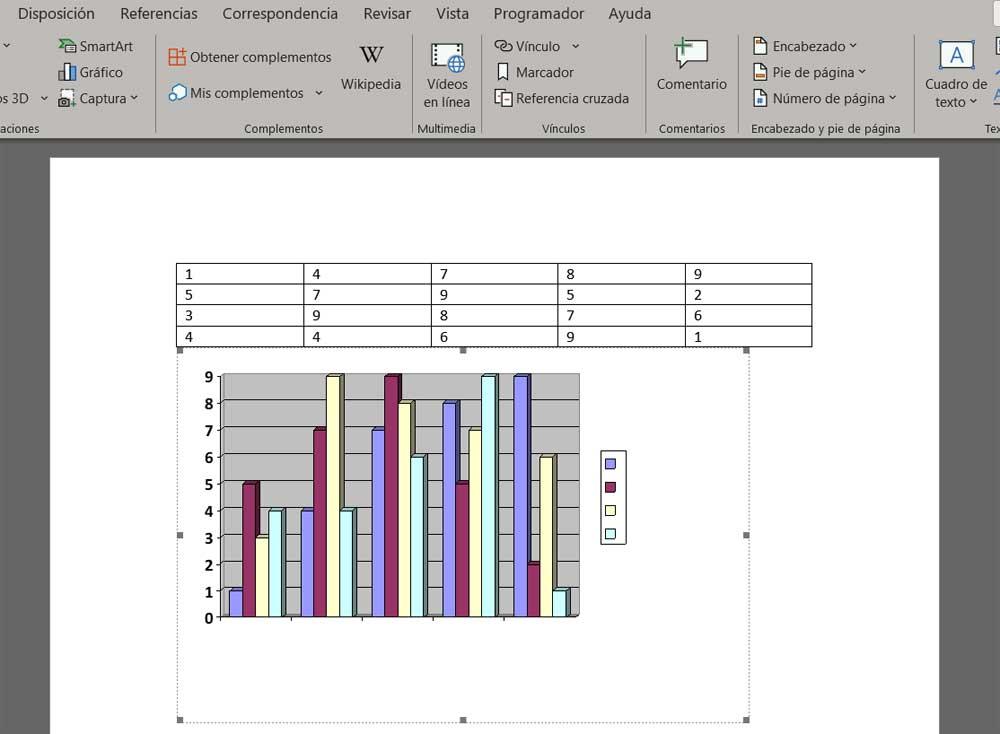
At that moment the new graph will appear on the screen and we will be able to resize it, edit it or change its appearance in a simple way.