Capsa Free main features
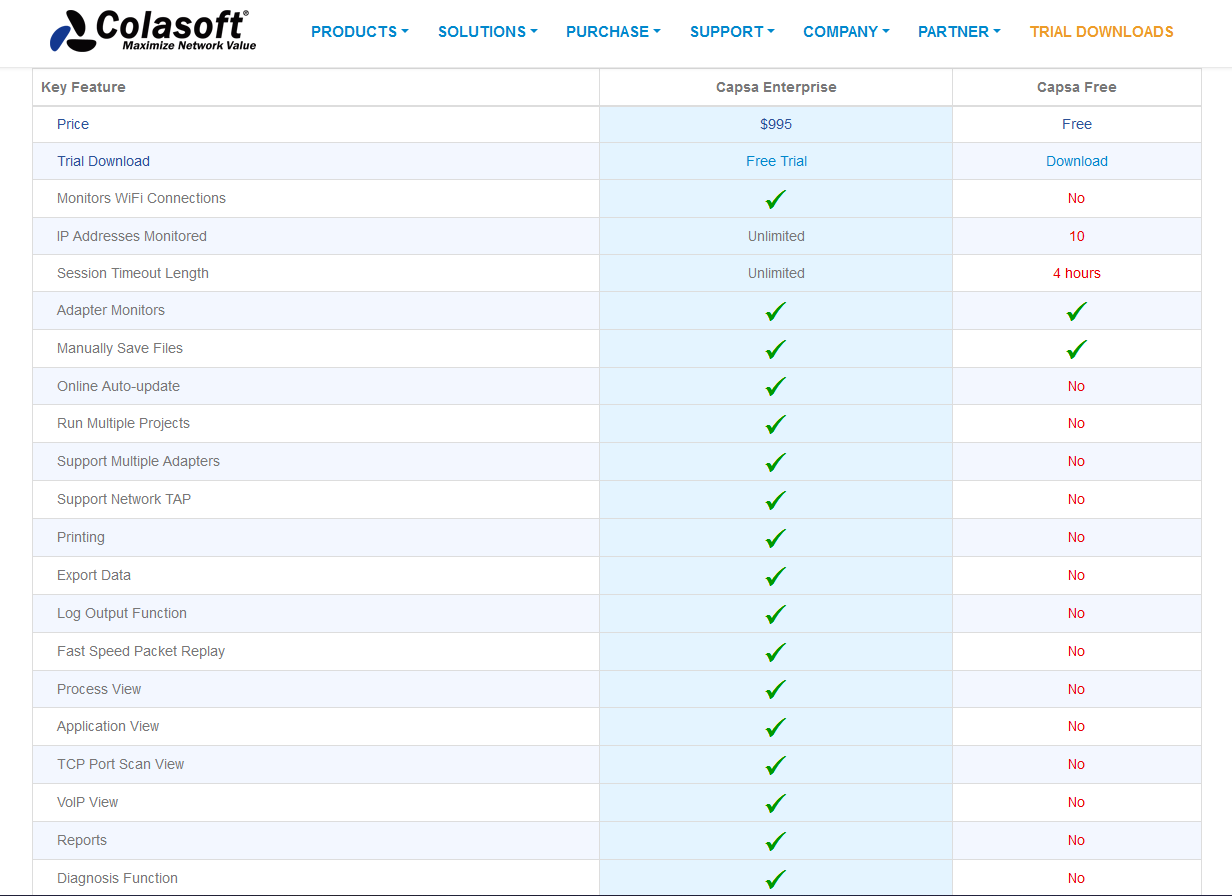
Colasoft has two versions of this Colasoft Capsa program, one is completely free, but with limited functionality, and the other is paid but has all the available features. We can use the free version without any problems, renewing the license key every four months to continue using the software. The paid version is worth $ 995 and we can download a “trial” version for 30-day trials, in this way, we can see all the features without paying anything and see if it is worth it.
The free version of Capsa Free It will allow us to monitor a total of 10 IP addresses of the local wired network for 4 hours in a row, we will be able to monitor only the wired interfaces, because we have the possibility of monitoring the WiFi connections. They are only available in the paid version «Enterprise». Another feature is that we can manually save the capture file for later treatment, however, we have many limitations that the paid version does allow us: automatic update, supports multiple network adapters simultaneously, supports TAP, we can export the data we capture , perform a TCP port scan, customize reports of all the information collected, see the DoS and ARP attacks and many other characteristics that you can find in the following table:
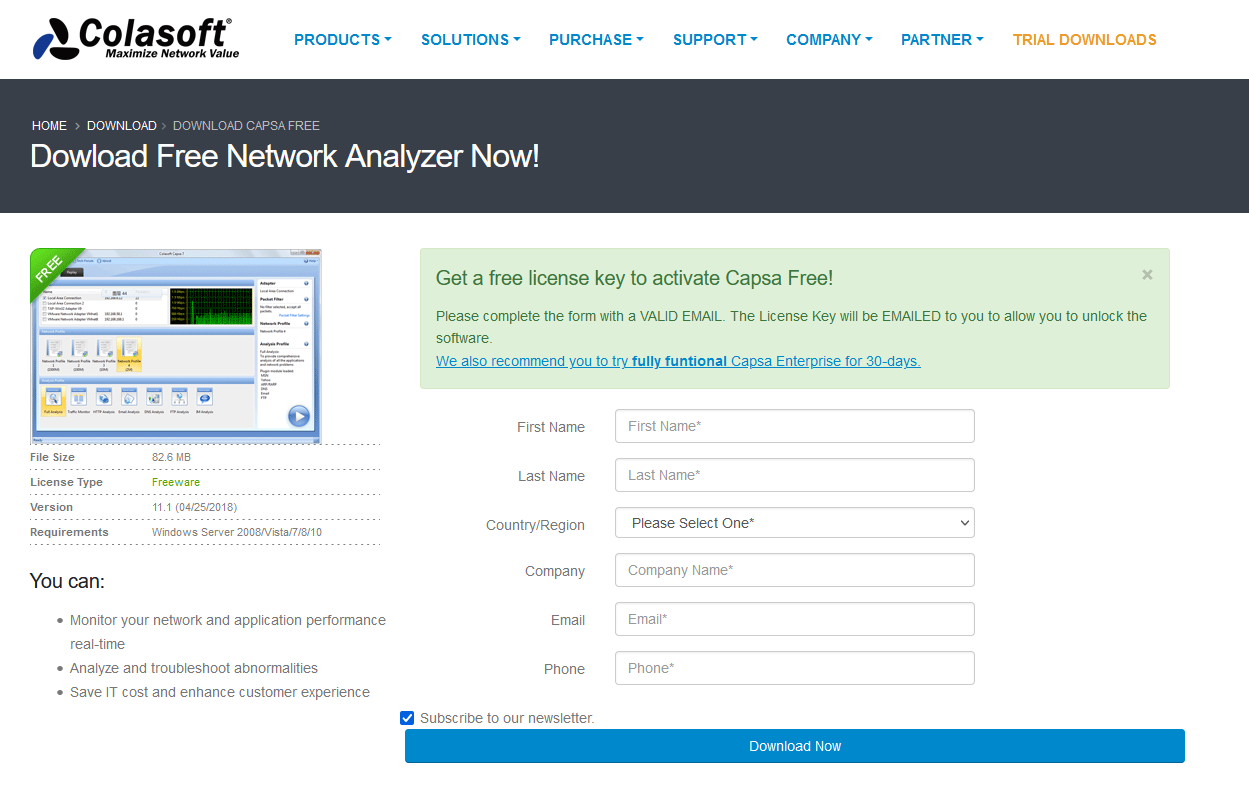
In order to download and use this program we will have to register completely free of charge, this software is compatible with Windows Vista, Windows 7, Windows 8, Windows 2008 and also Windows 10. On the official website we will have to put a real email address, because that is where we will receive the license key to activate the free version of the software:
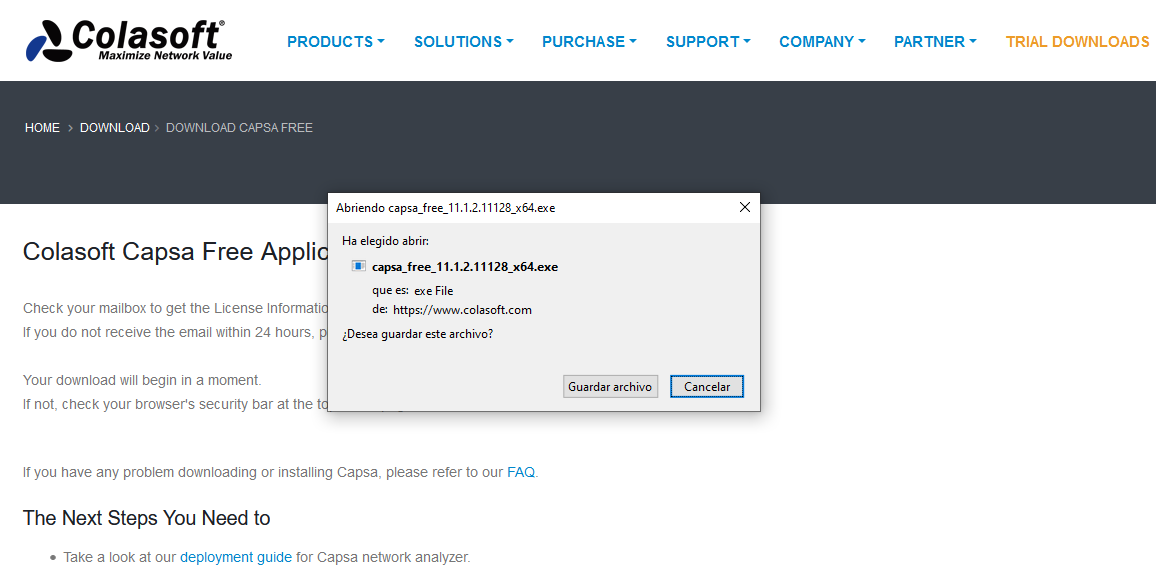
Once we have filled in everything, we must click on «Download Now» and a notification will automatically appear indicating that we can download Capsa Free, click on «Save file» for later installation.
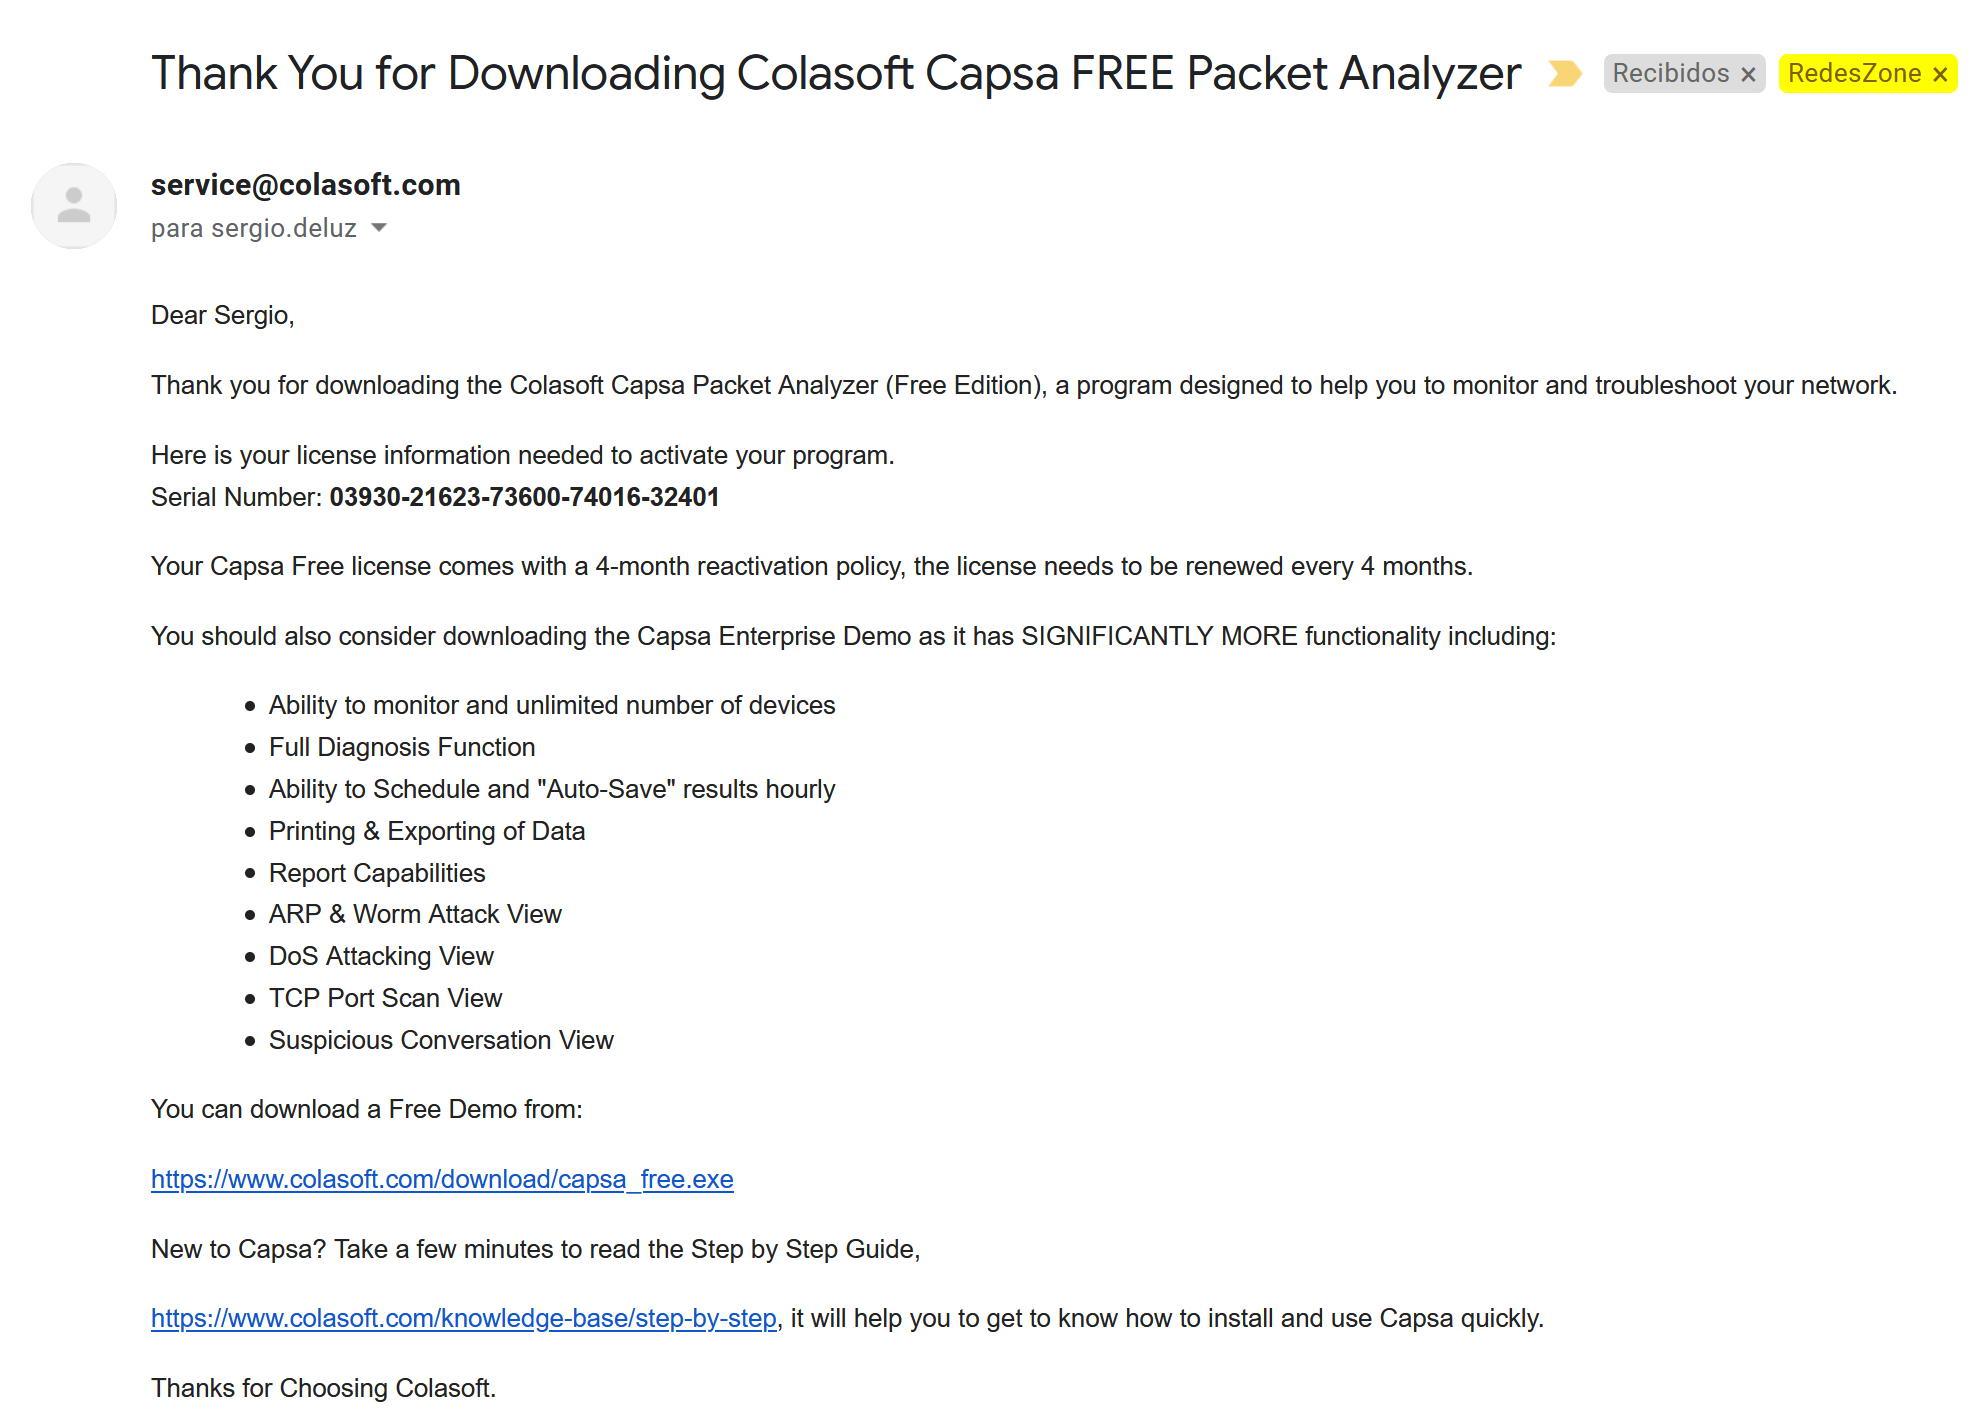
While the software is downloading, in our email tray we will see an email indicating the serial number that we must enter, and also that we will need to reactivate the software every four months. In addition, in the email that you can see below, they invite us to try the Capsa Enterprise demo version where we will have all the additional features to this Capsa Free program.
Once we have downloaded the software, we can install and activate it easily and quickly.
Capsa Free Installation and Activation
The installation of this program is as simple as in the rest of Windows programs, an installation wizard will appear that we must follow and click on «Next» to follow the steps, it does not require any additional software installation to do its work, however, it will install a suite of free tools such as “Mac Scanner”, “Ping tool” and others to increase the functionality of the software. In the following gallery you can see all the steps that we must follow:
Once installed, if we launch the program, it will tell us that we must activate it. We will run an activation wizard to enter the license key that we have received by email. In the first menu we click on «Next», it will indicate that we must enter the serial number of the license in the box, and if we want to activate it online (it is recommended to do so), once we have entered the key, it will automatically verify that it is correct and let us use the program.
When the activation wizard has finished, it will indicate the limitations of this free version:
- Only the first 10 private IP addresses will be scanned.
- Can only be monitored through a network card
- You can only have one project open at a time
- Only one package file can be parsed by replay.
- We will not be able to customize the main menu nor will we have other interesting features that the “Enterprise” version does have.
Once we know how to install and activate this software, we will see the main configuration and display options.
Colasoft Capsa 11 Free Operation and Options
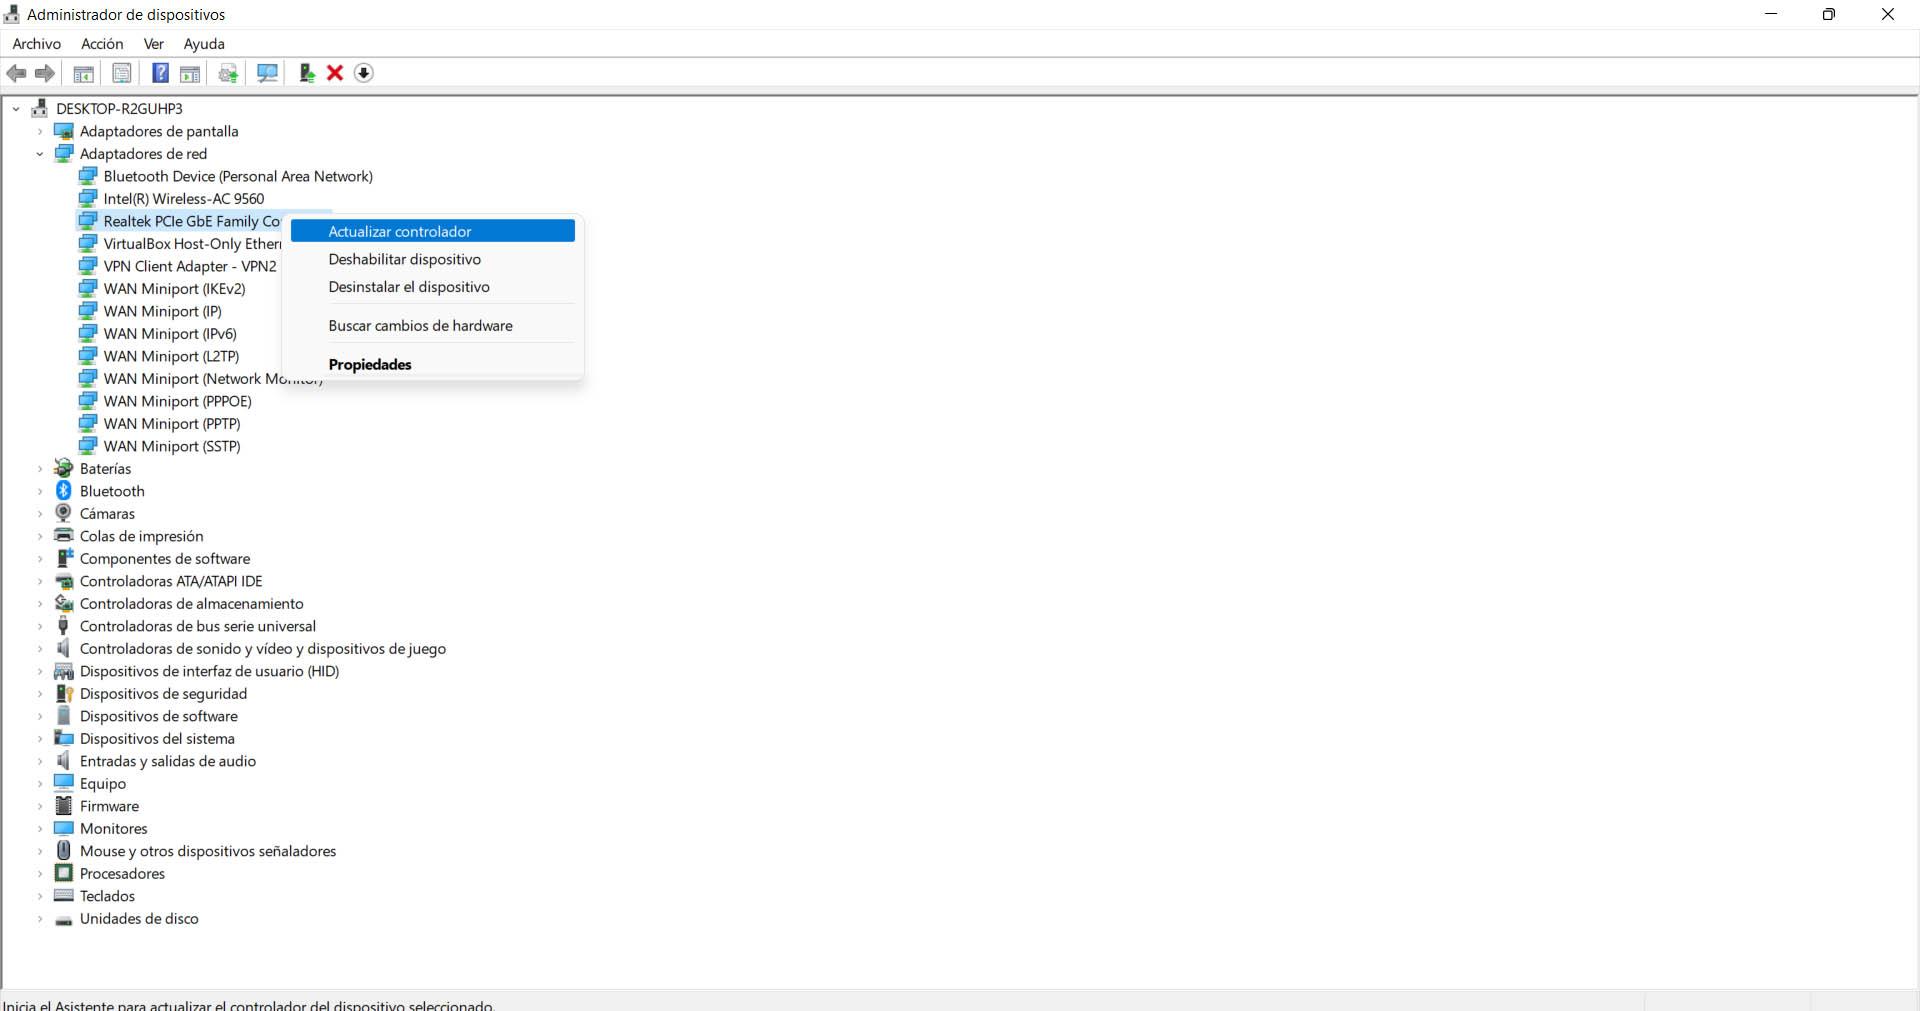
The operation of this program is very simple, later when we go to analyze all the information that we have available we will have it perfectly organized to find everything we need. In the main menu we will have to choose which physical network interface we can use, we will click on the white box selecting the physical interface. Once selected, we will have to choose which analysis profile we want to take, there are different types of profiles to only collect and display the information that interests us:
- Complete analisis
- DNS traffic analysis
- HTTP traffic
- Email Traffic
- DNS traffic
- FTP traffic analysis
Once we have selected the profile, we will click on the green button that indicates “Start”.
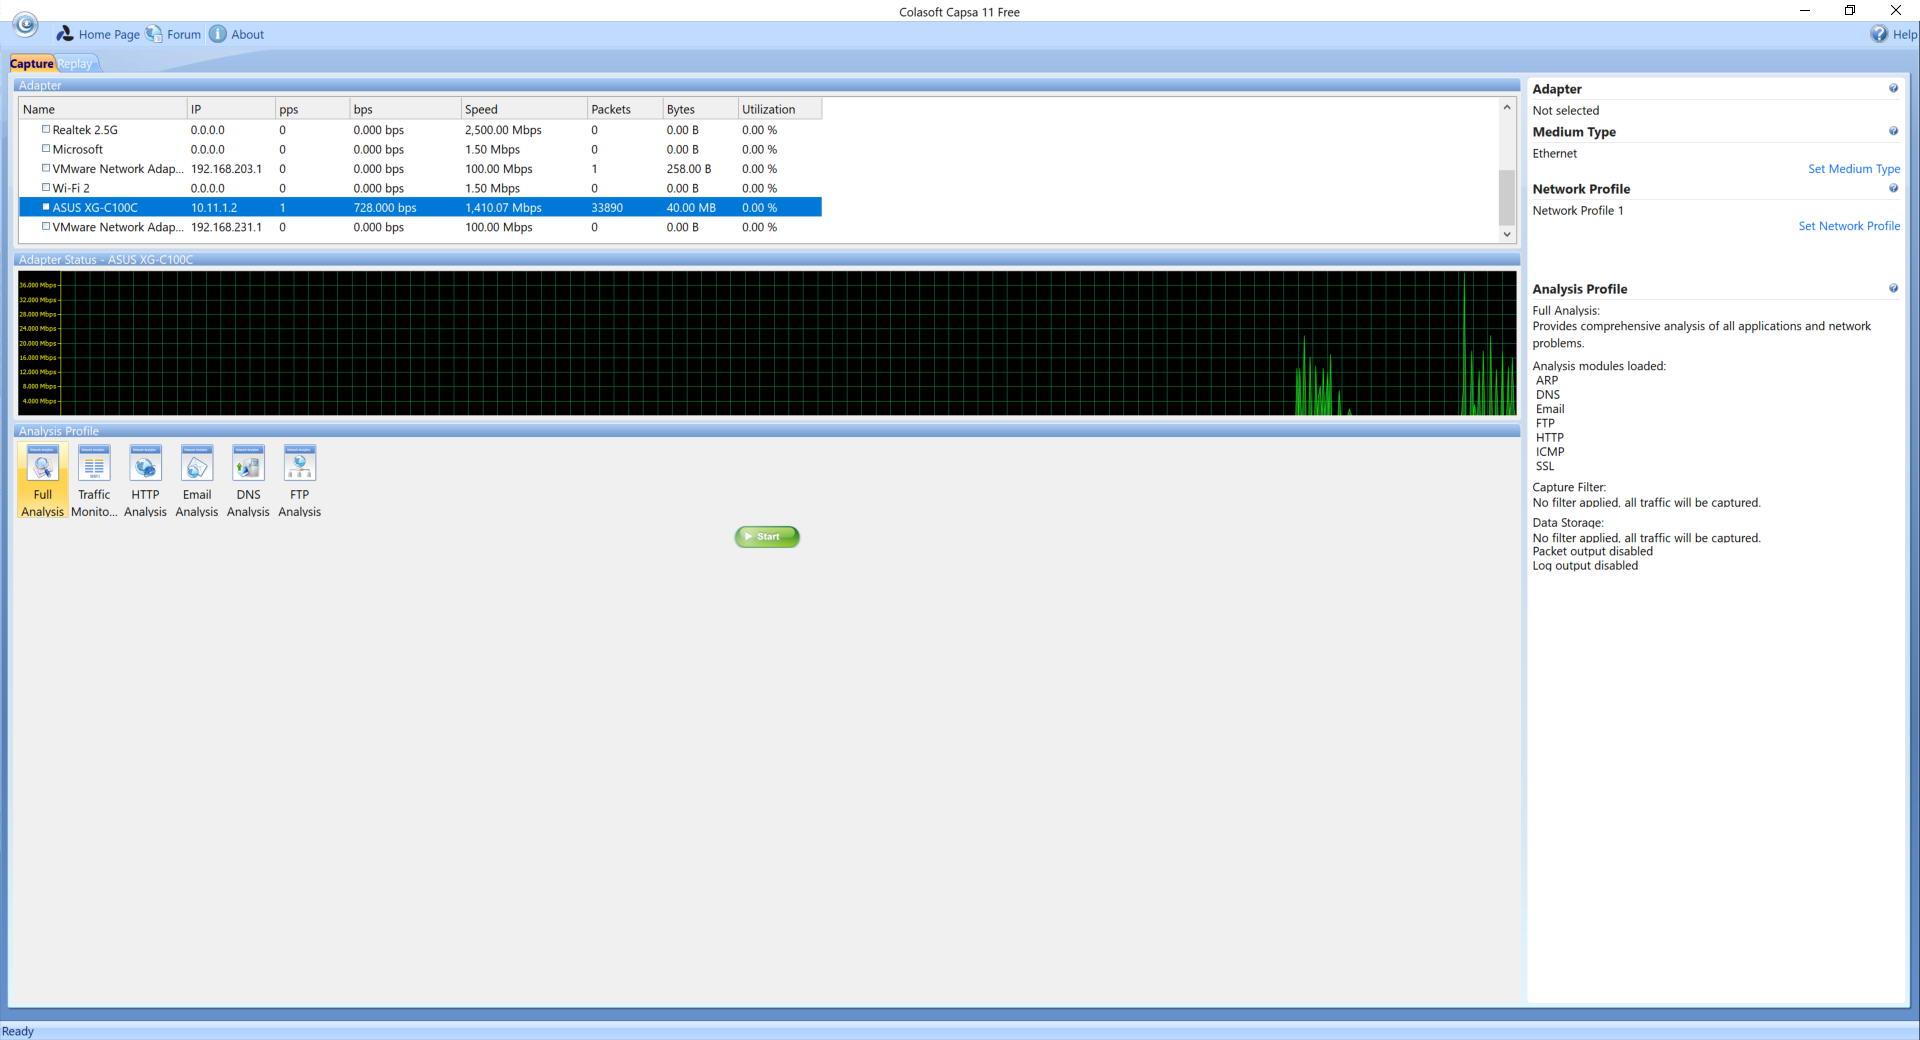
If we go through the different profiles, on the right side it will indicate which modules it has loaded to check all its traffic, logically, if we select “Full Analysis” we will be able to select all the information. Depending on our needs we can choose one profile or another, we have chosen the analysis of “FTP” only, but you can choose the profile you want.
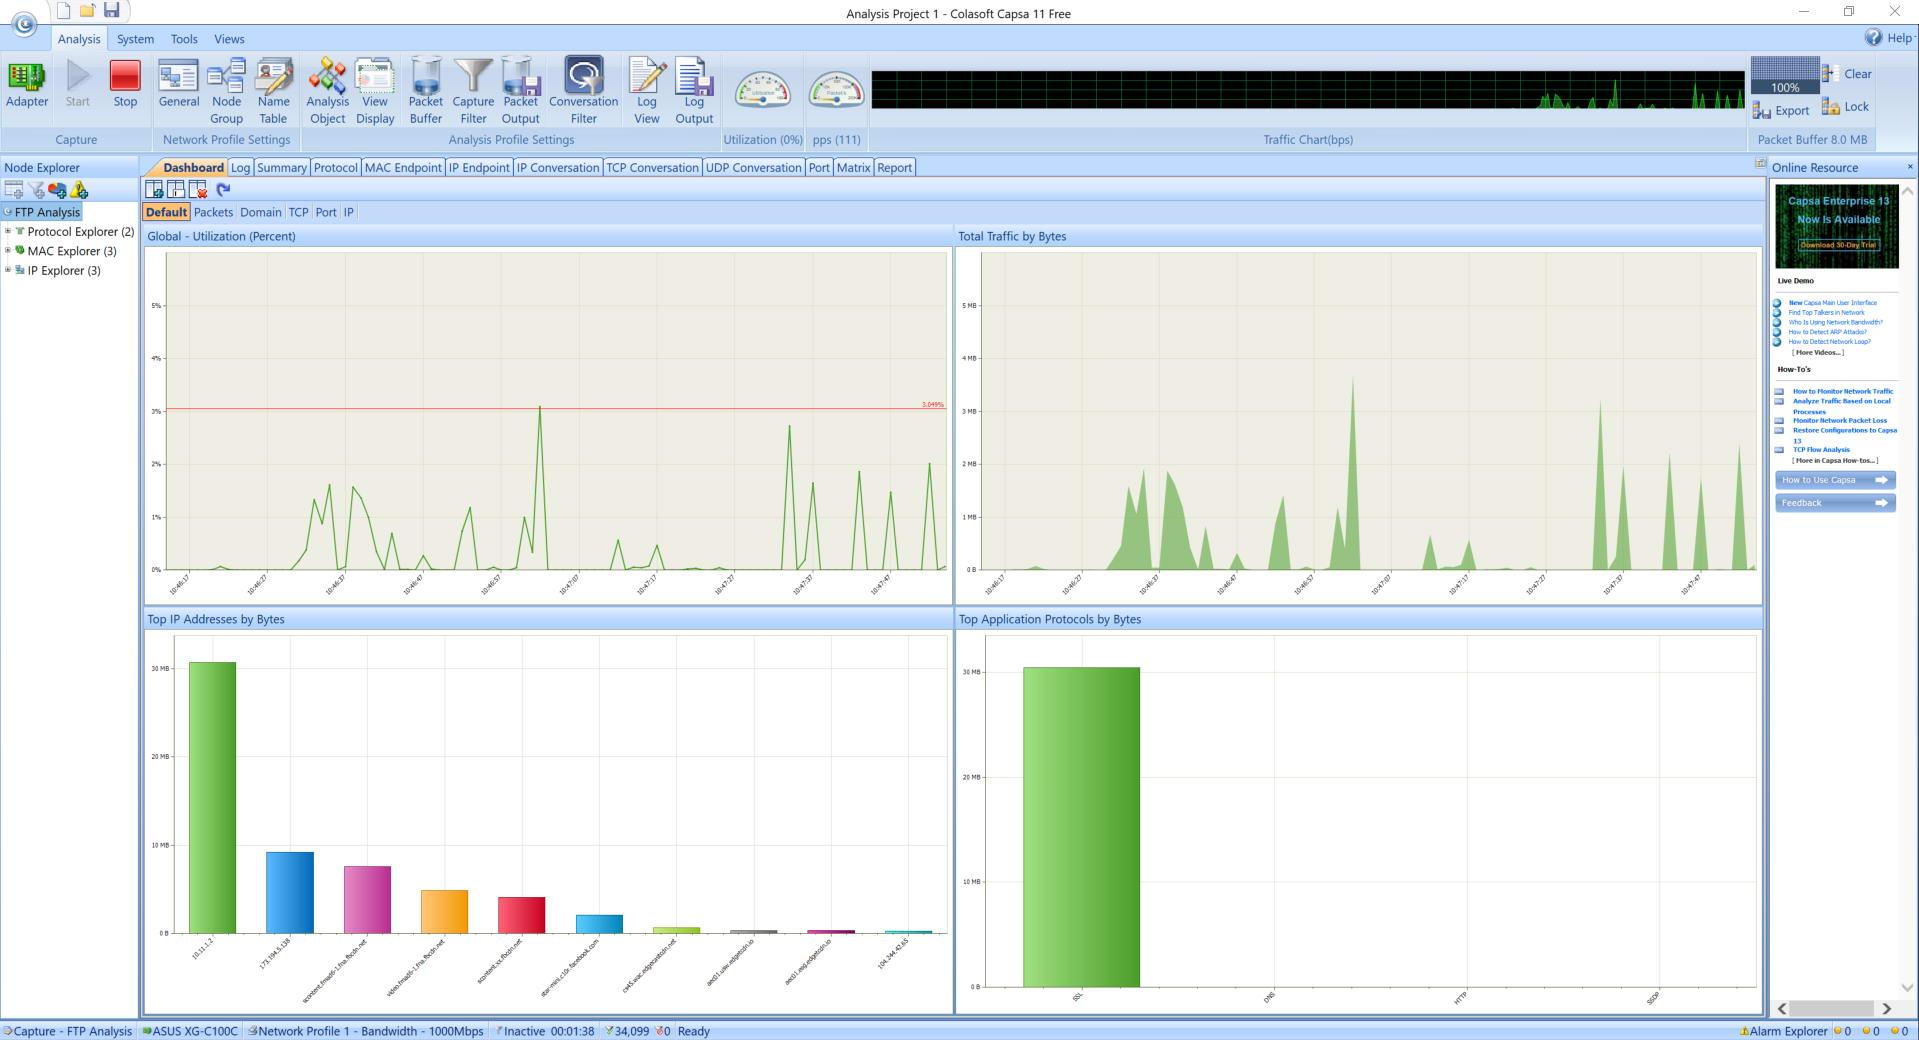
In the main menu we can see the use of the link and the traffic in bytes that we are sending and receiving, in the upper part we can access different options available and even change the Ethernet network card, we can also see the analysis of FTP traffic in a way easy and fast.
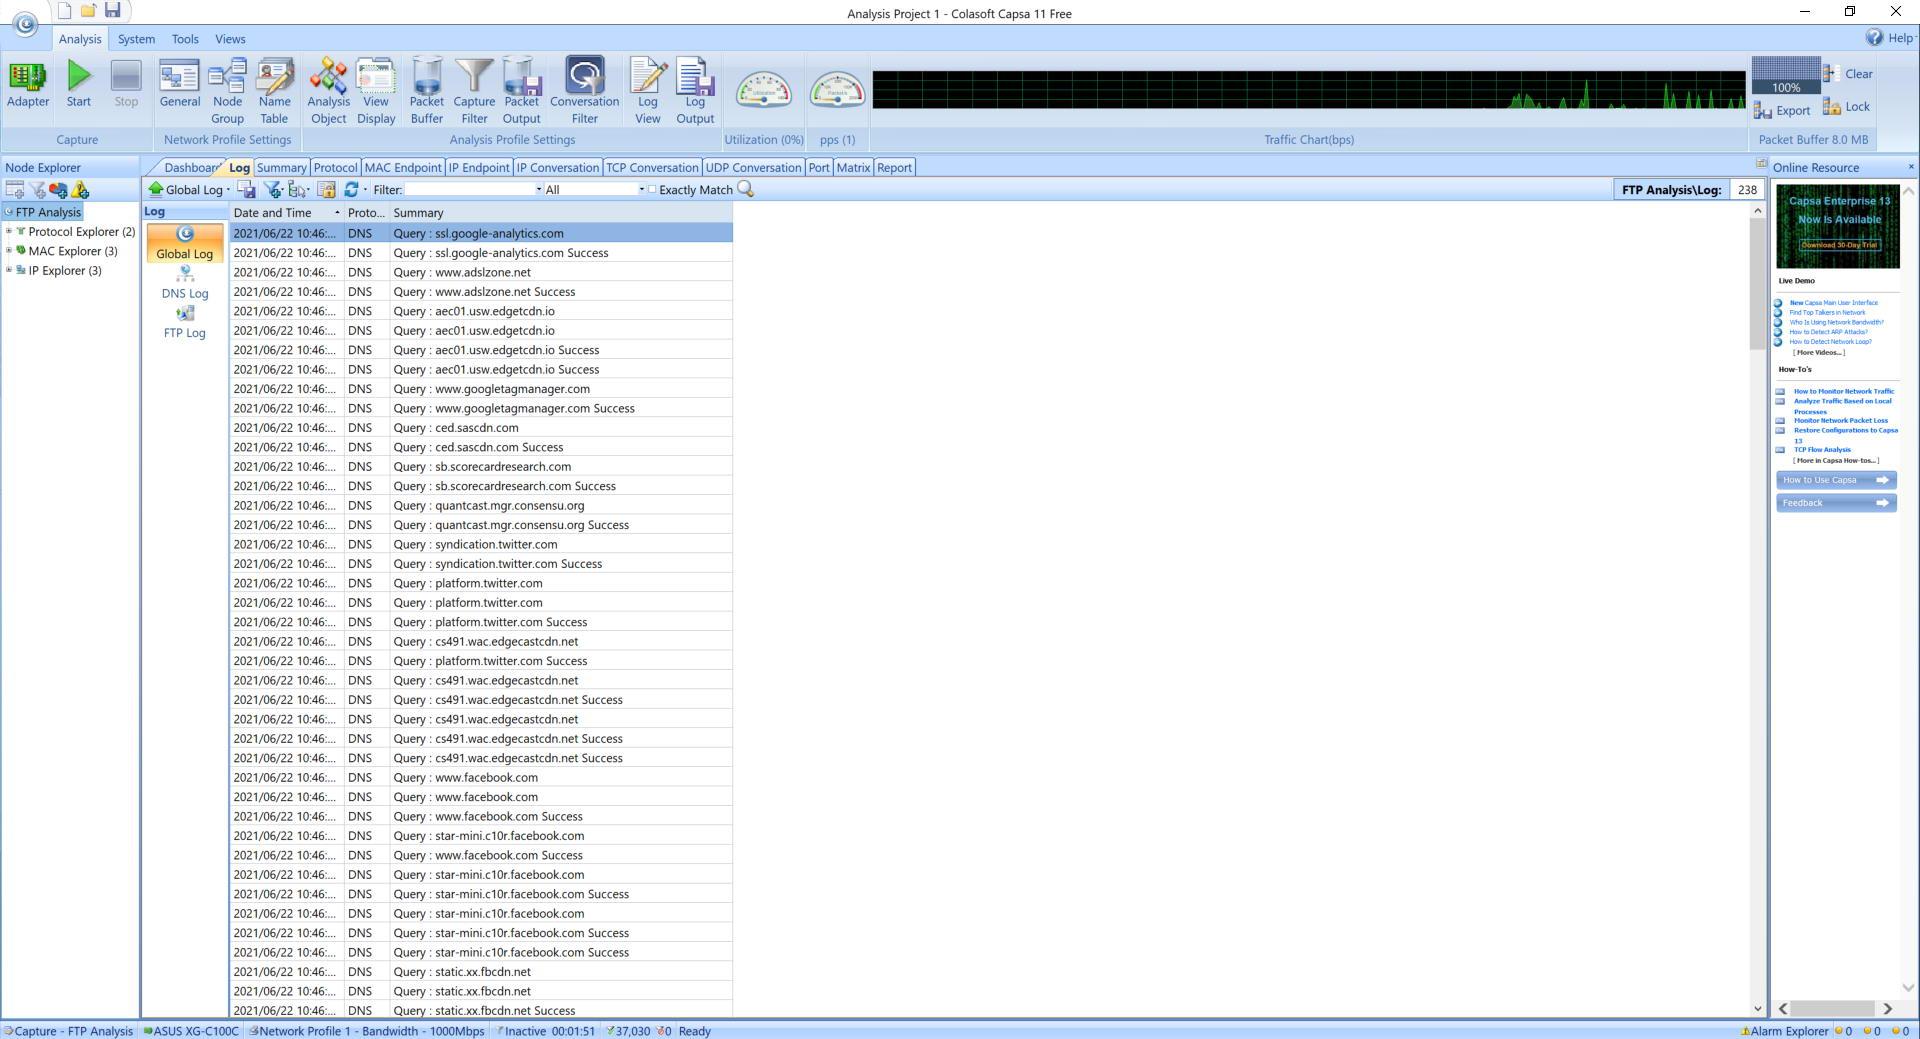
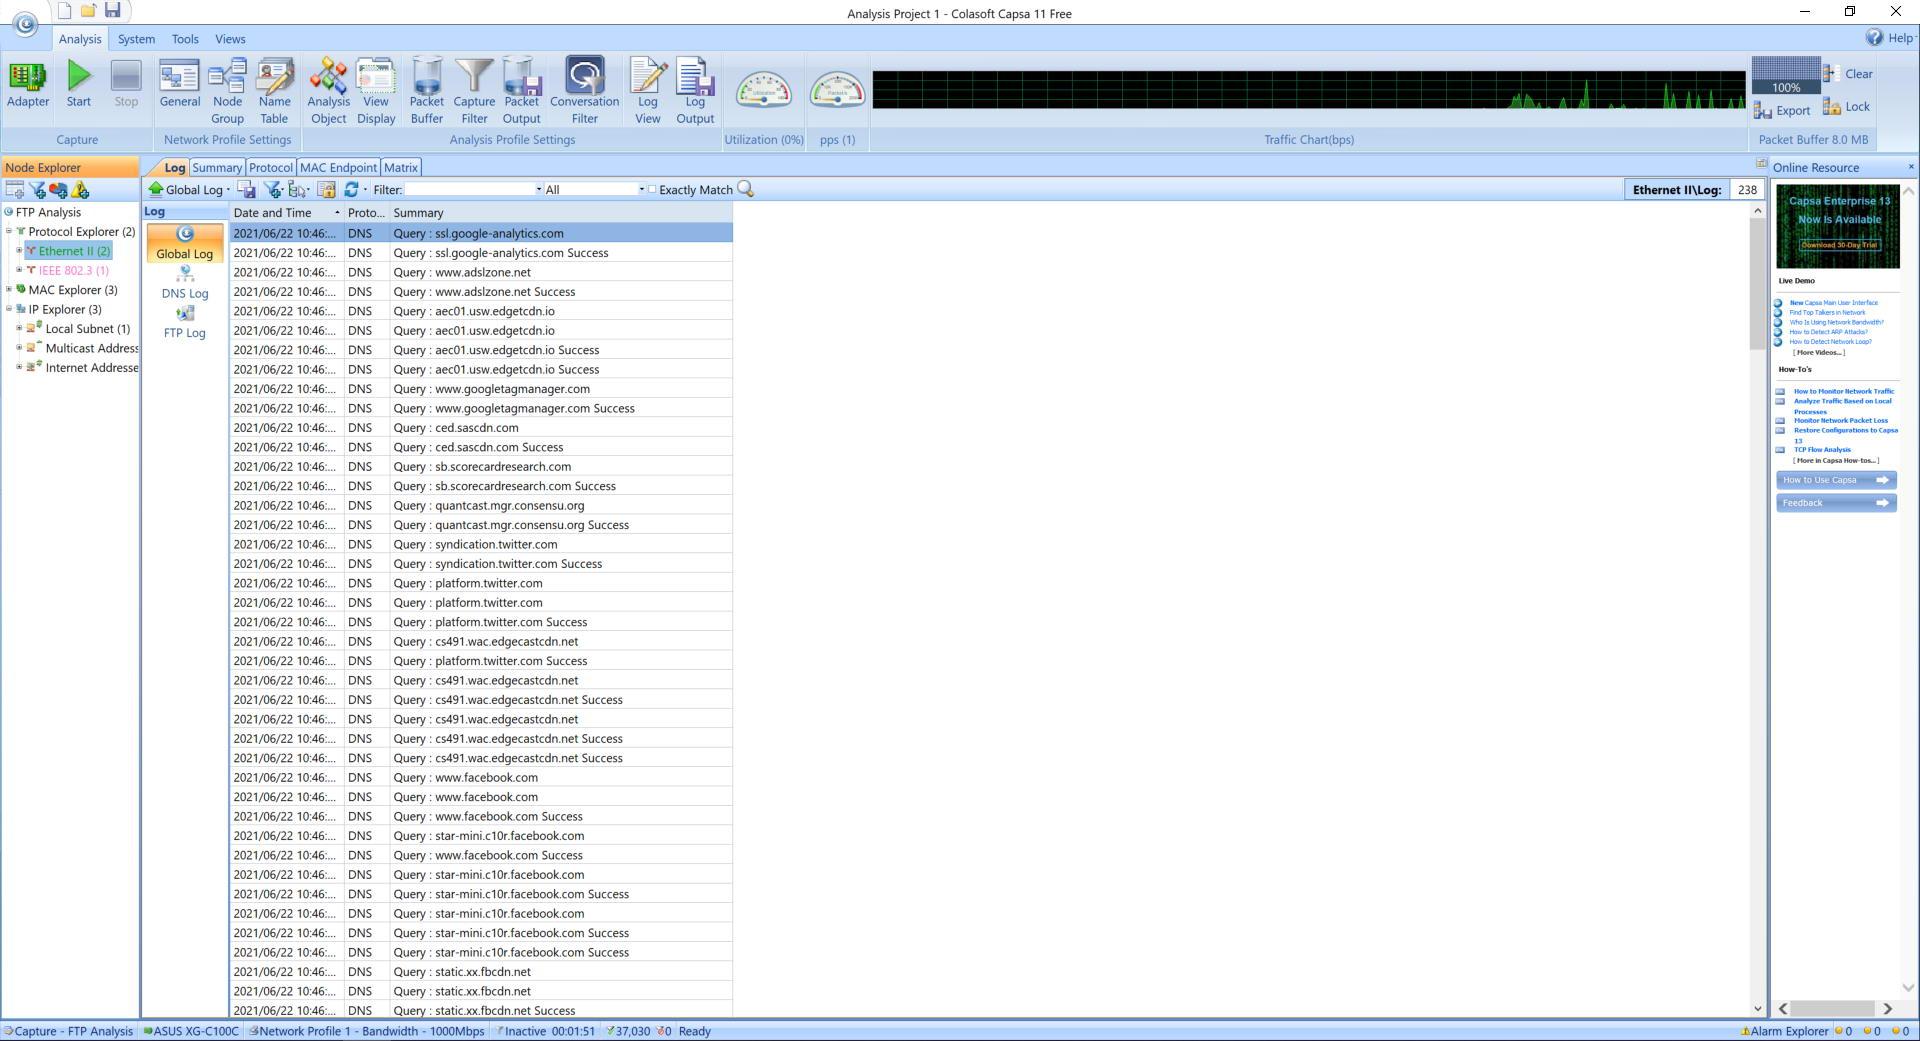
In the “Log” section we can see all the DNS-level registration that we have made with our equipment, and also the FTP log if we have made this type of communication.
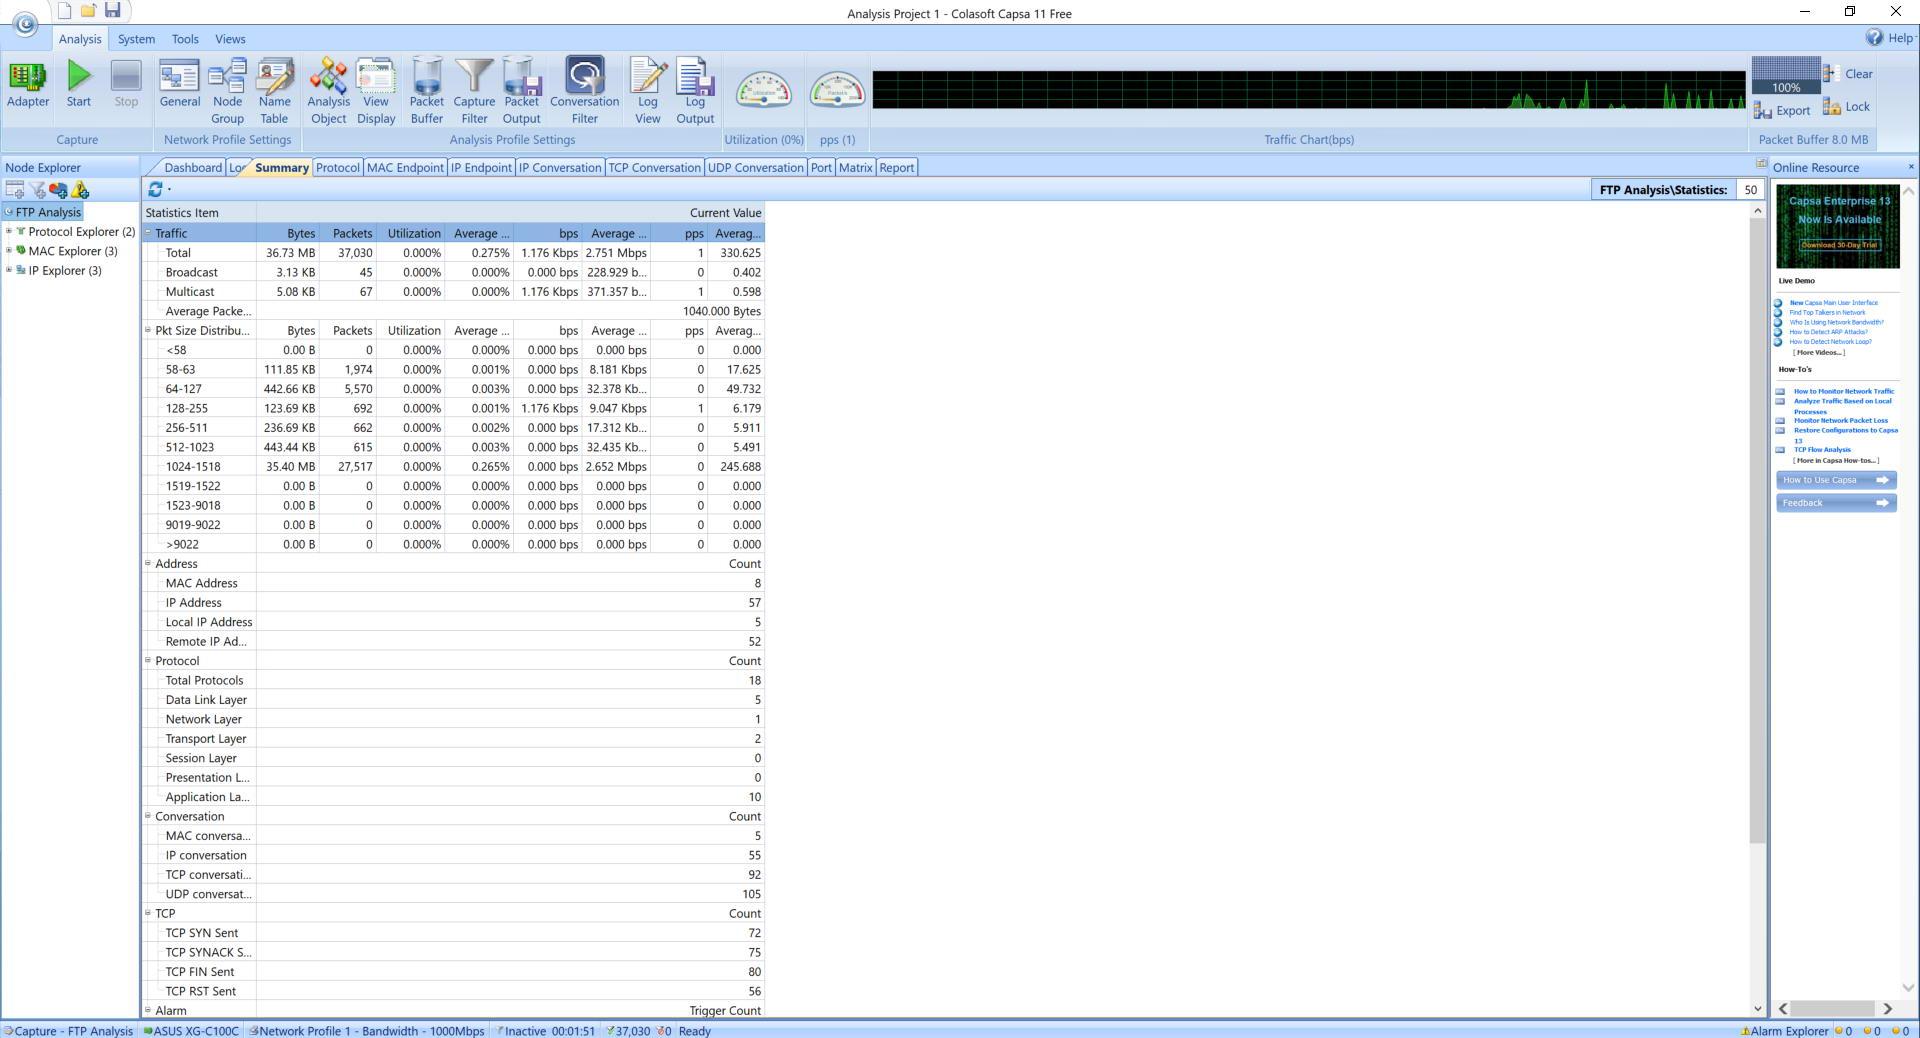
In the «Summary» section we can see packet exchange statistics, the current ones in real time, the average and other important information.
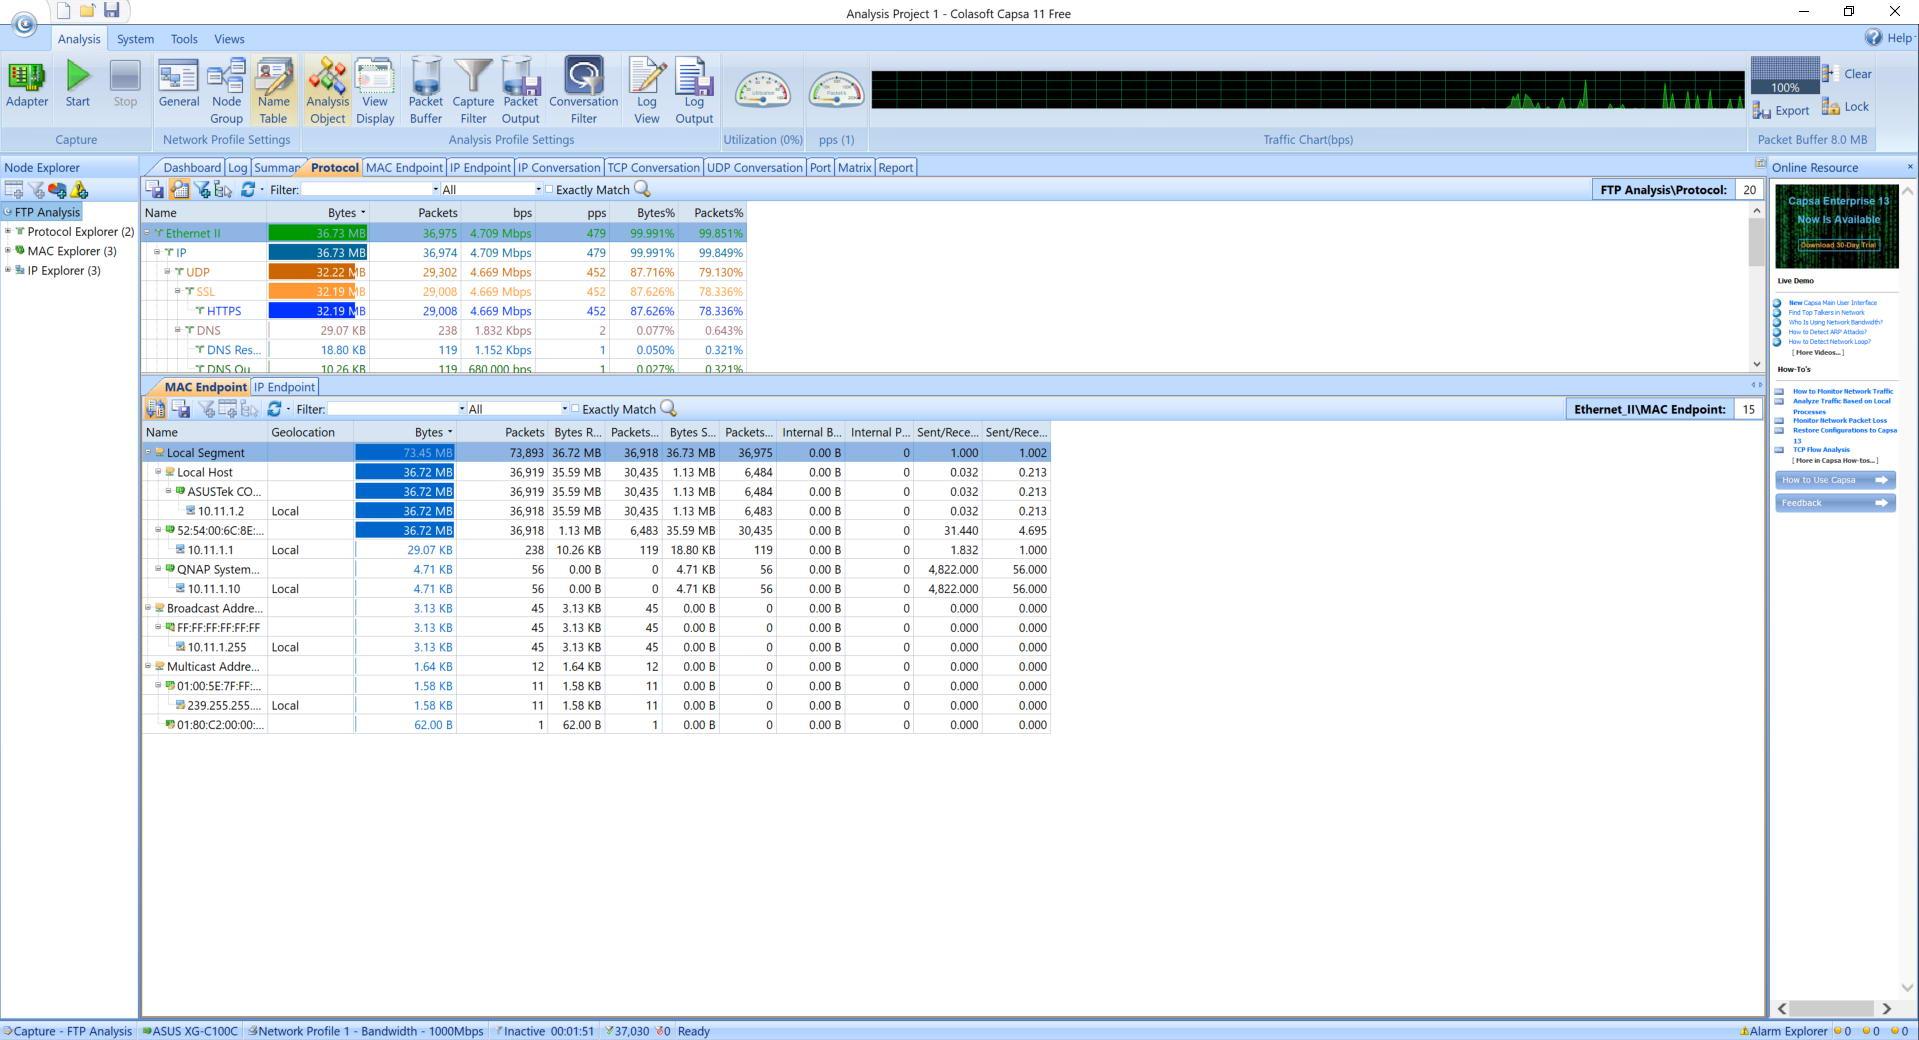
In the “Protocol” section we can see a classification by protocol of the bytes sent and received, as well as the total of the packets, right at the bottom we can see to which MAC address the different packets go and even their IP address, all this shown in an easy to understand way.
In the “MAC Endpoint” section we can see all the MAC addresses that it has detected on the network when communicating with the different computers, we can see all the communications made by us and those made to us.
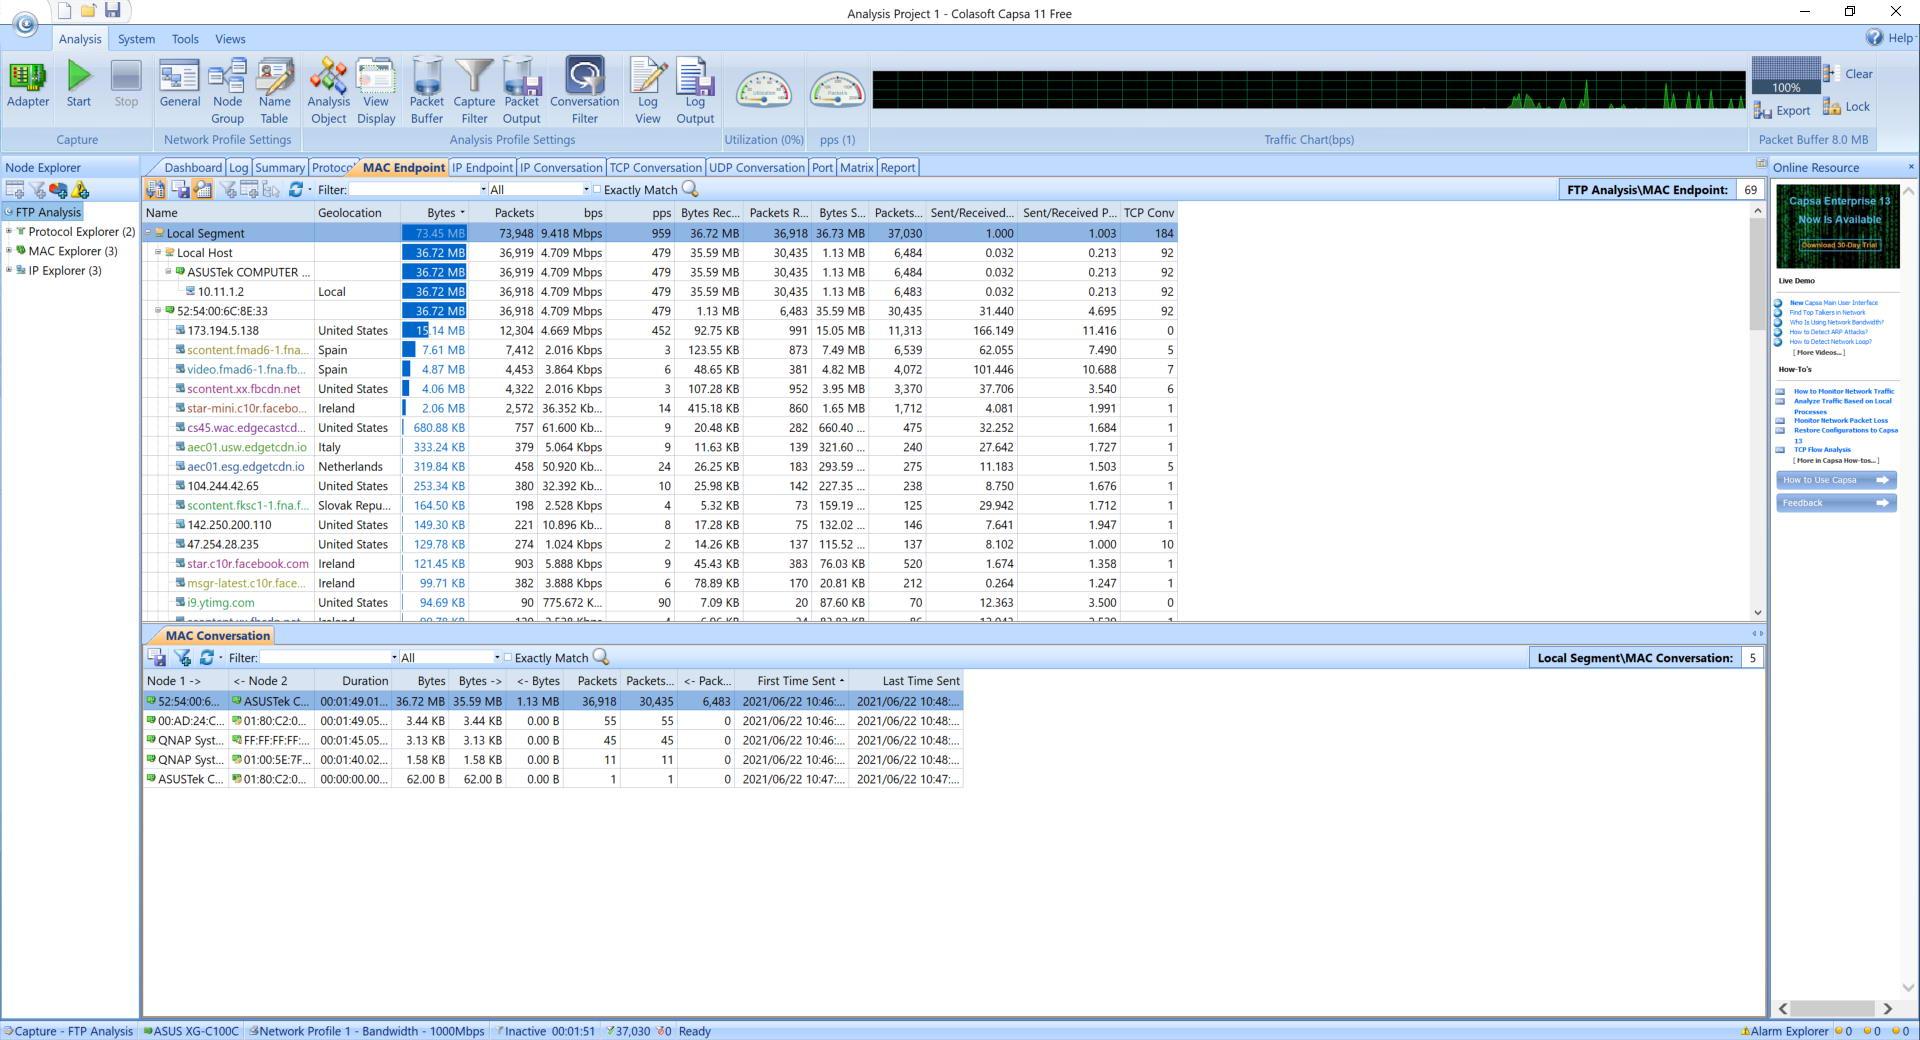
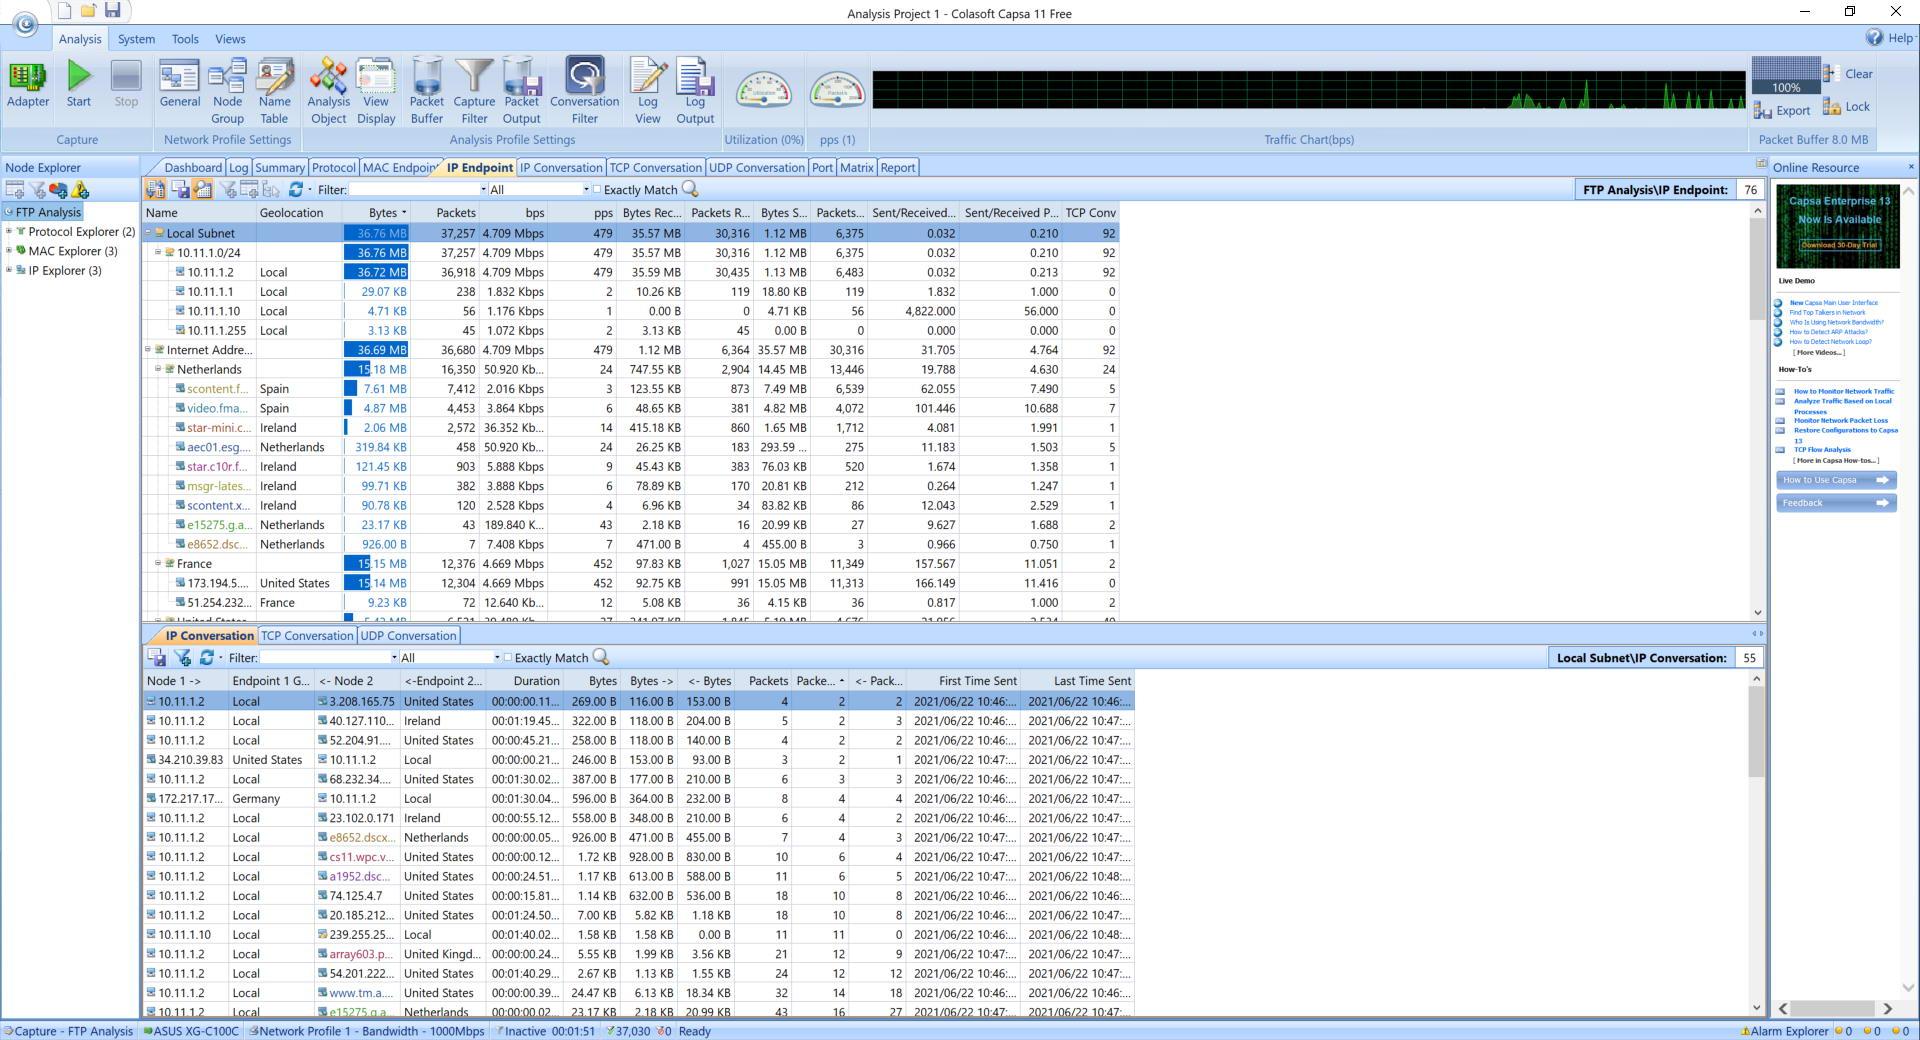
The same happens with “IP Endpoint”, instead of showing us the MAC addresses, we can show the related IP addresses and with which we have made communications. Another important detail is that it will show us the country where we have made a specific communication, ideal to know with which countries we are communicating.
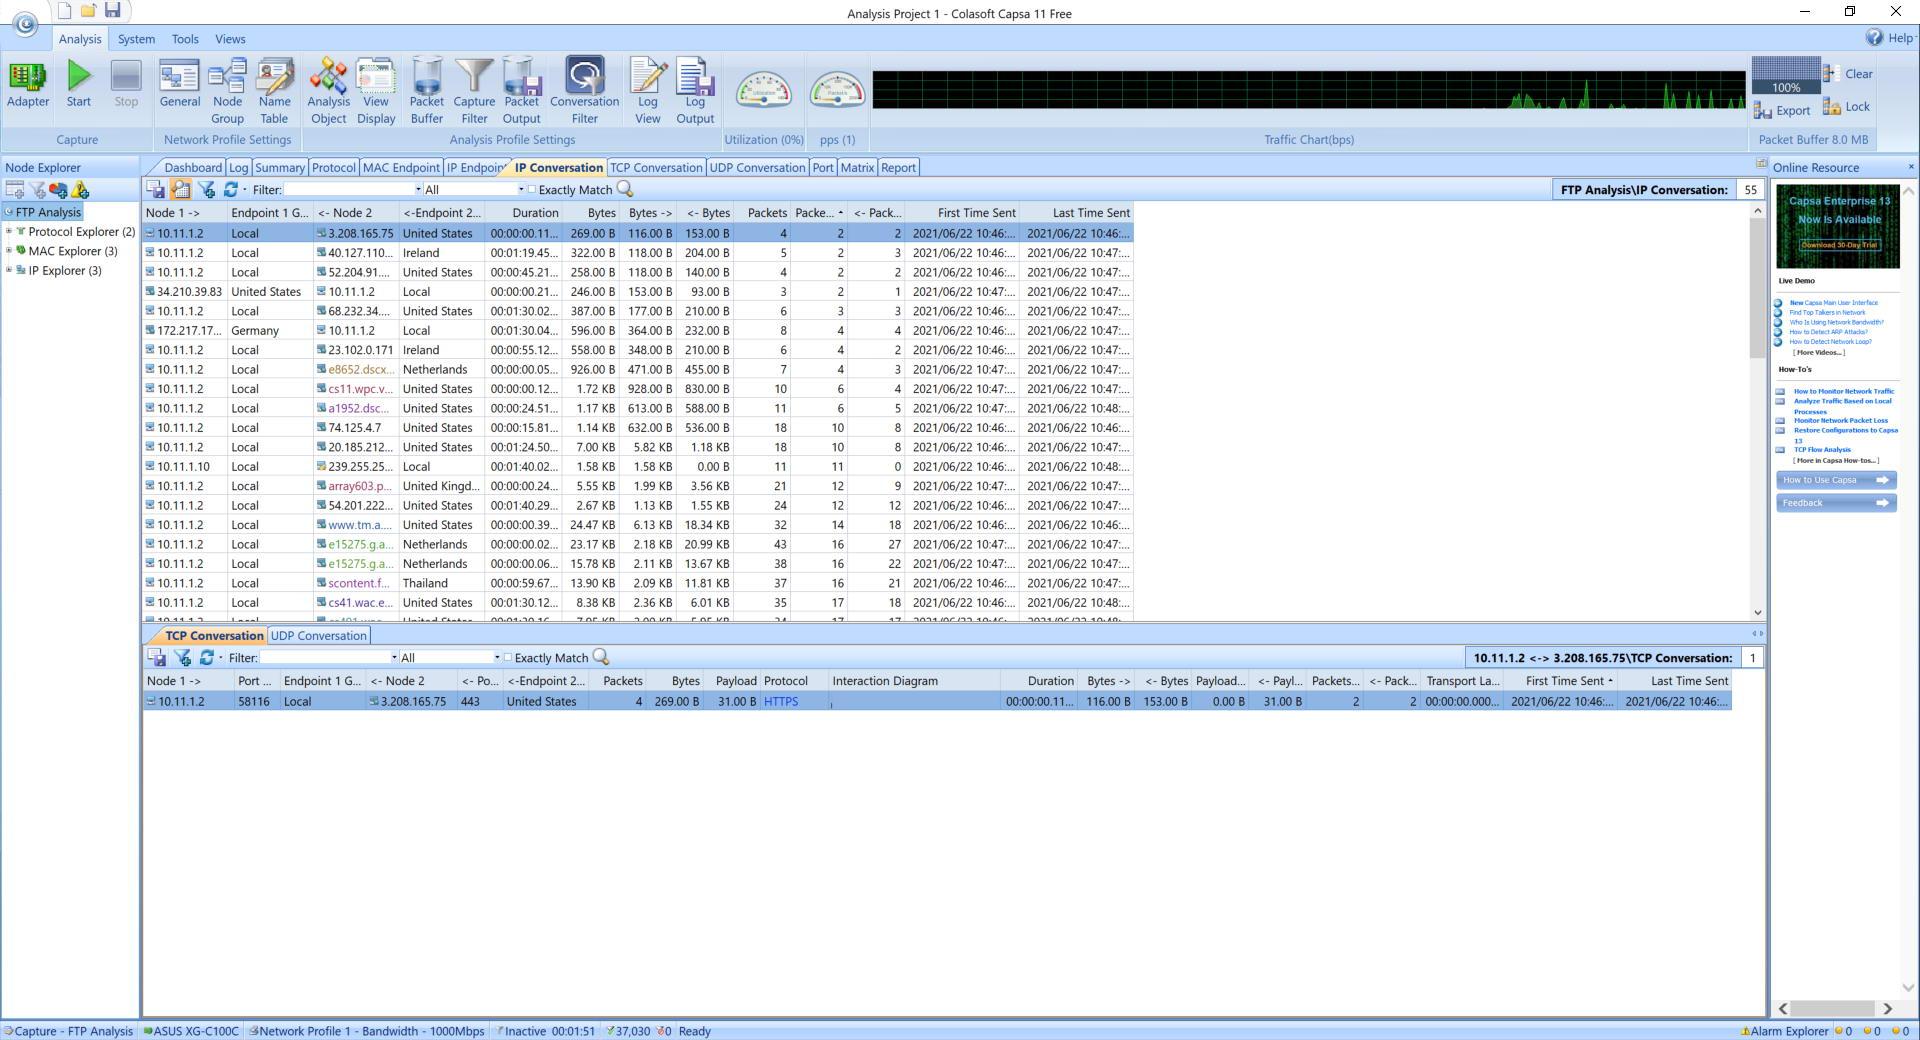
In the “IP Conversation” tab we can see the origin and destination of the different packets, showing us the country where that specific IP address is located, in addition, we can see the duration, the bytes sent and received and much more information, and everything it very easy to understand.
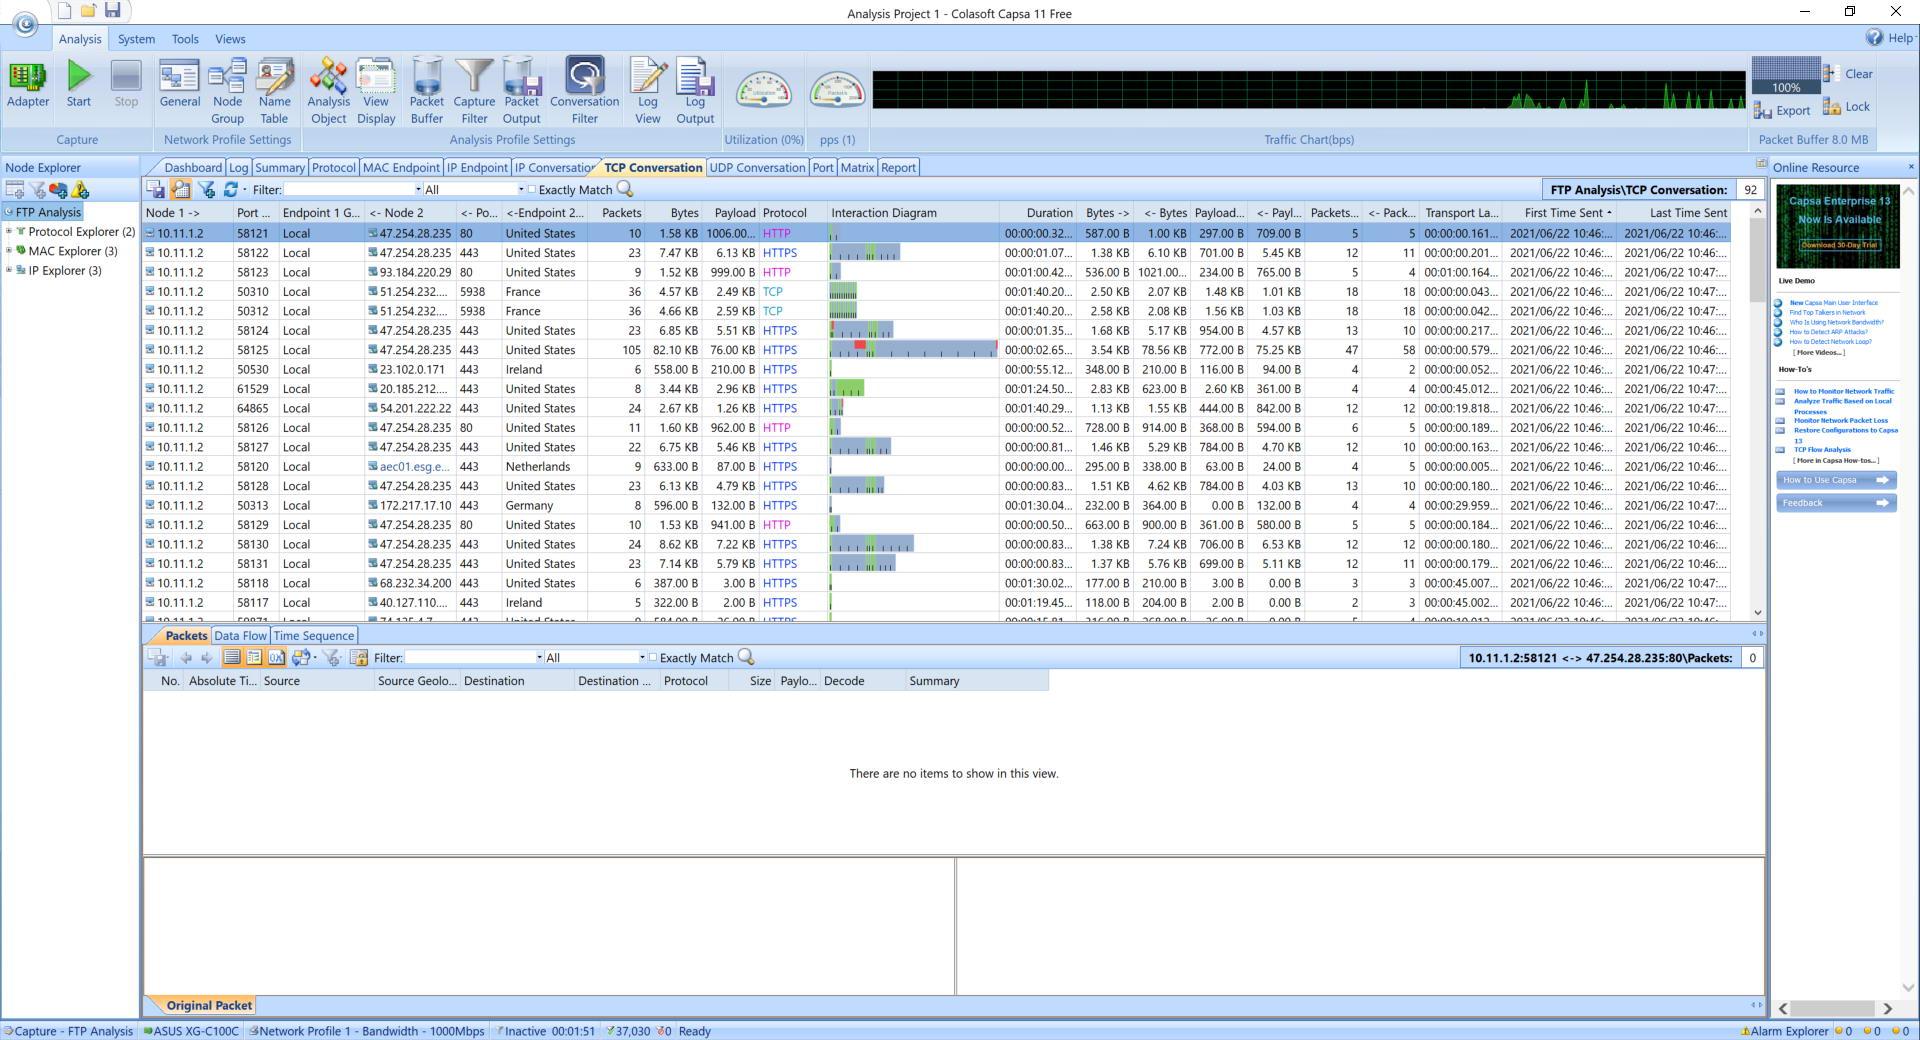
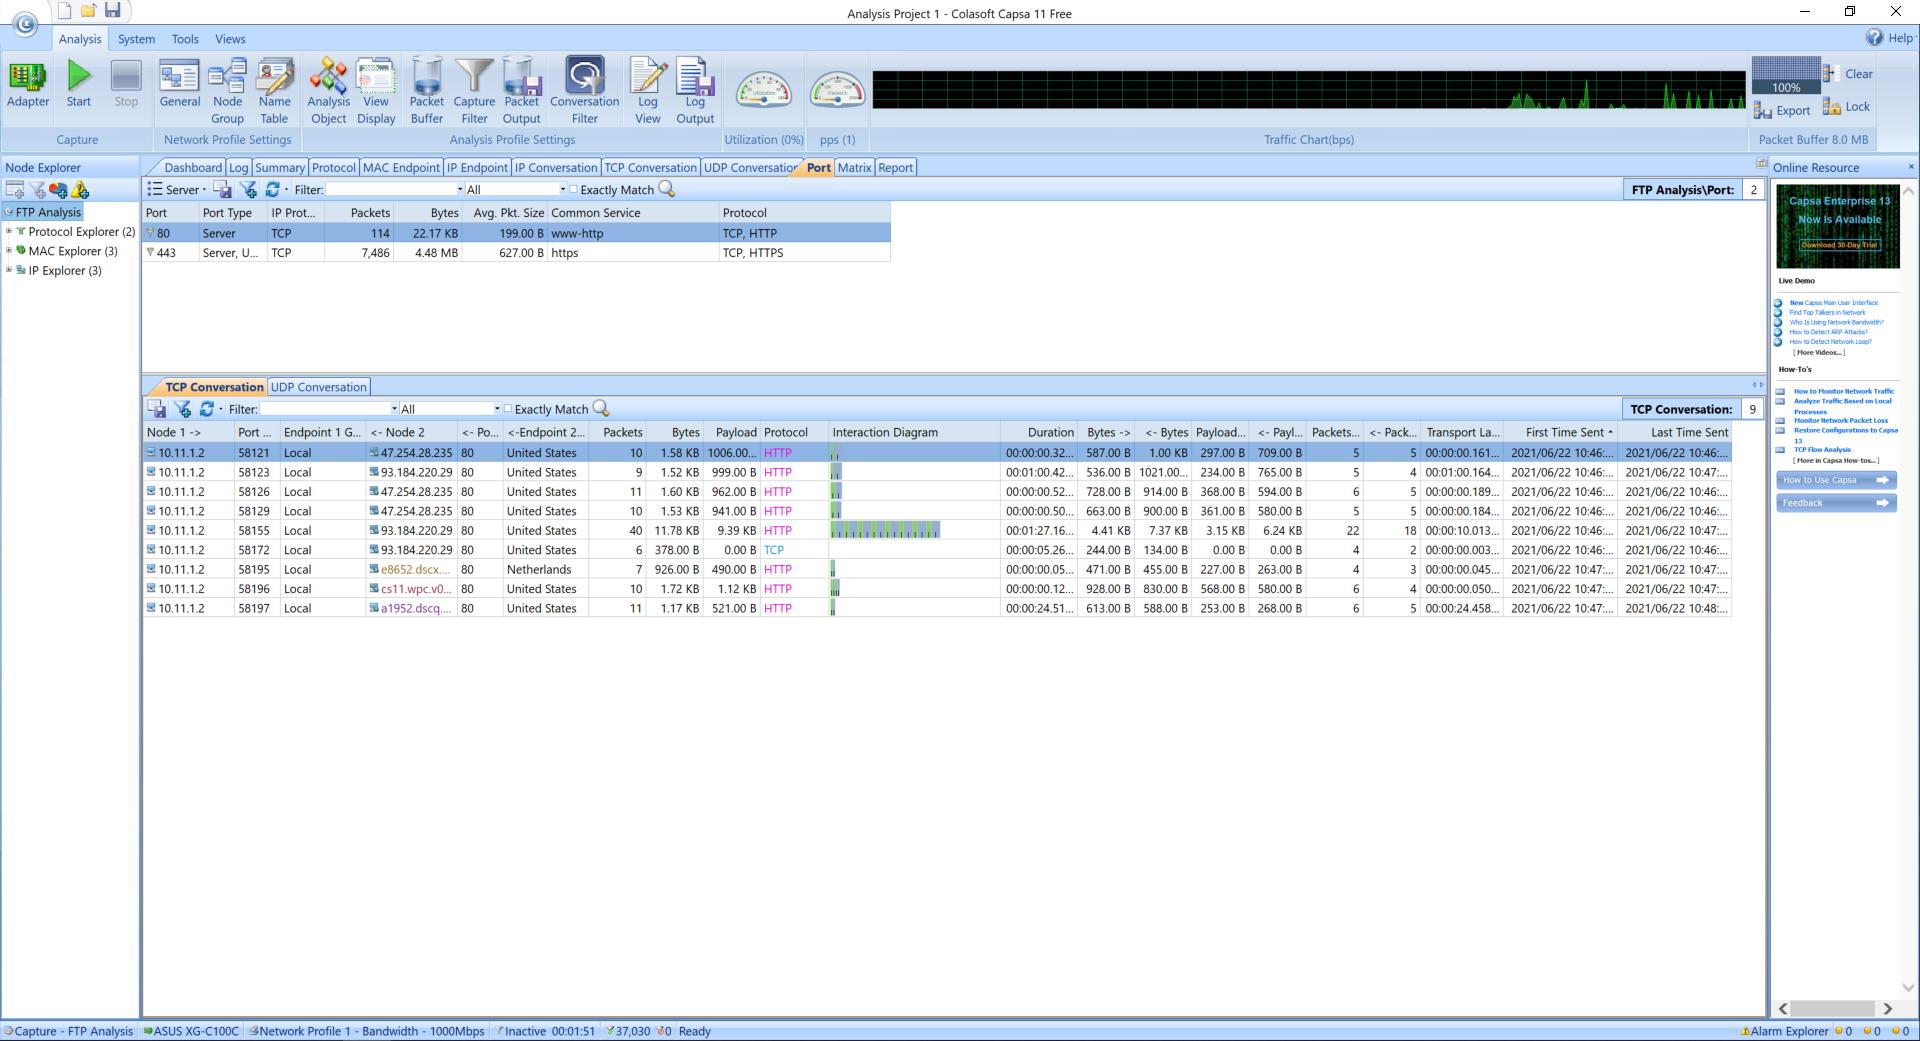
In the “TCP Conversation” section we will see all the TCP communications that we have made, with their corresponding origin and destination, duration, bytes sent and received and more information.
In the “UDP Conversation” section we will see all the UDP communications that we have made, mainly the traffic made by UDP is the DNS traffic.
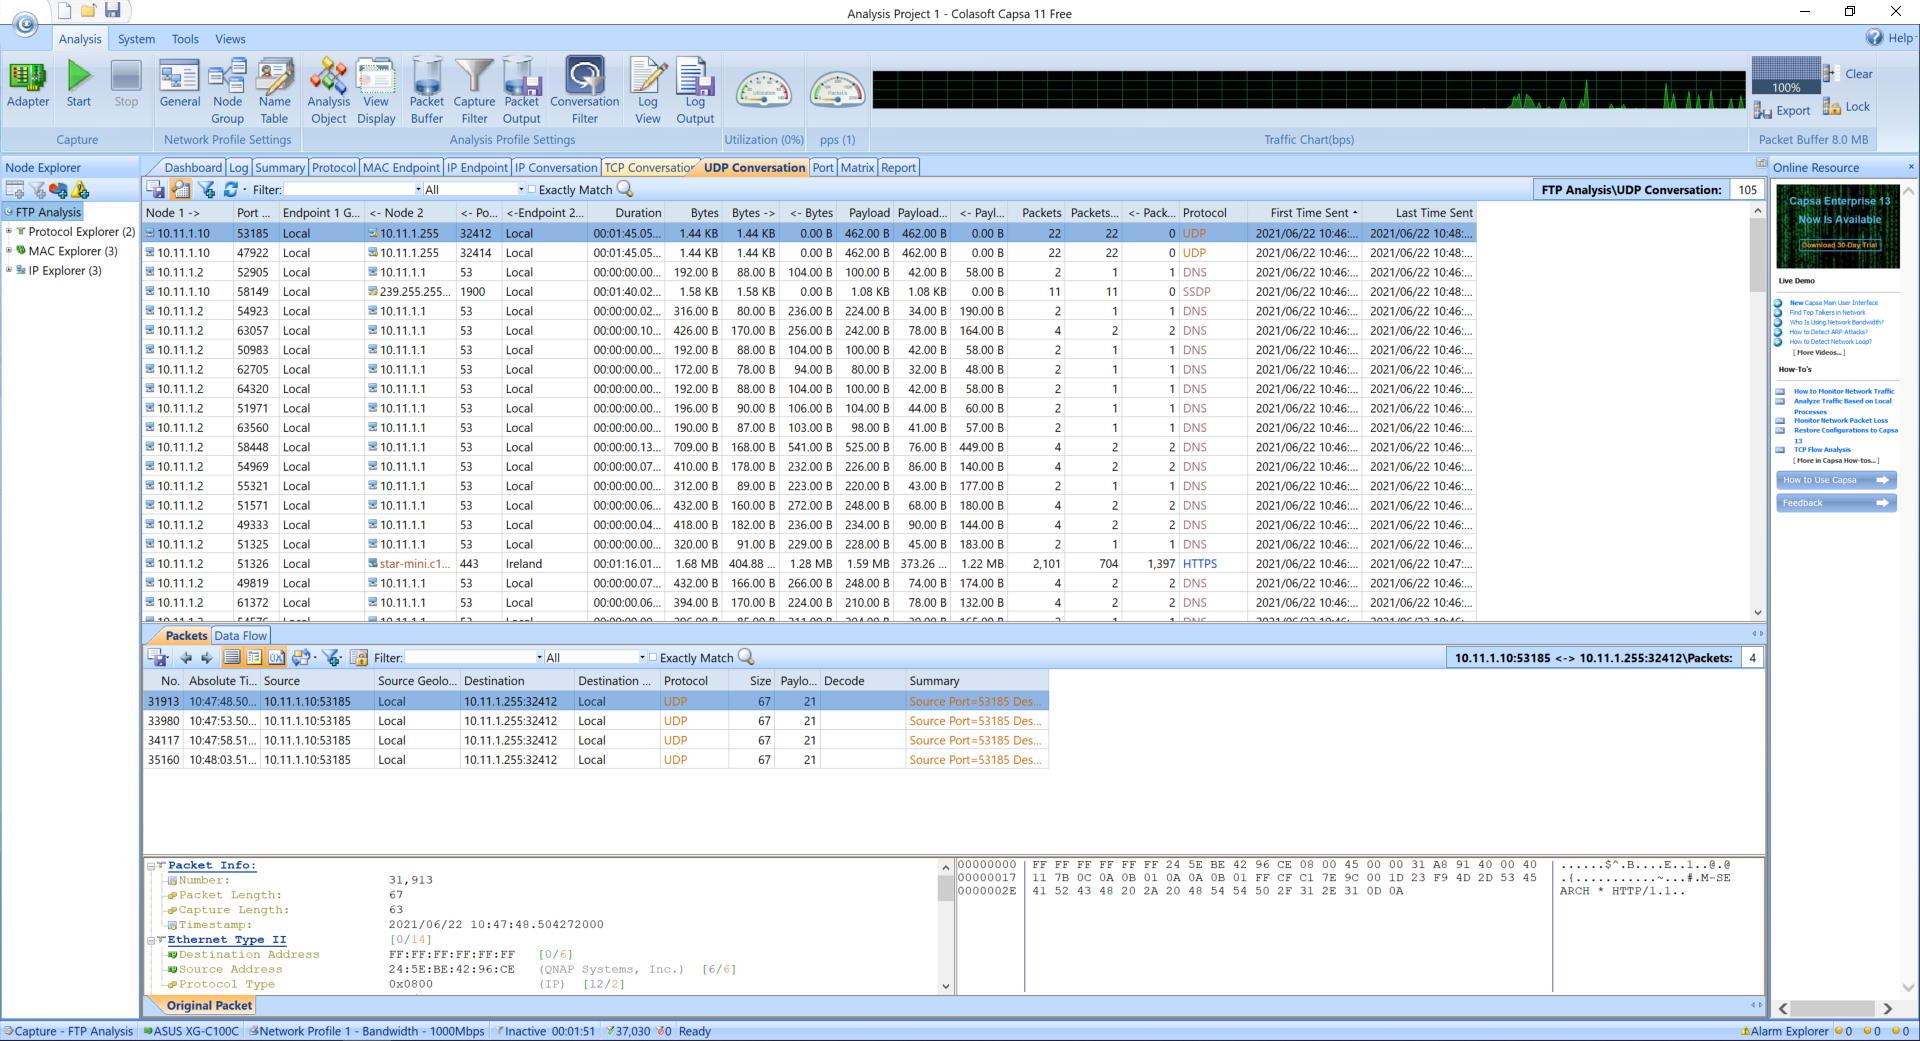
We can also see the different ports of origin and destination.
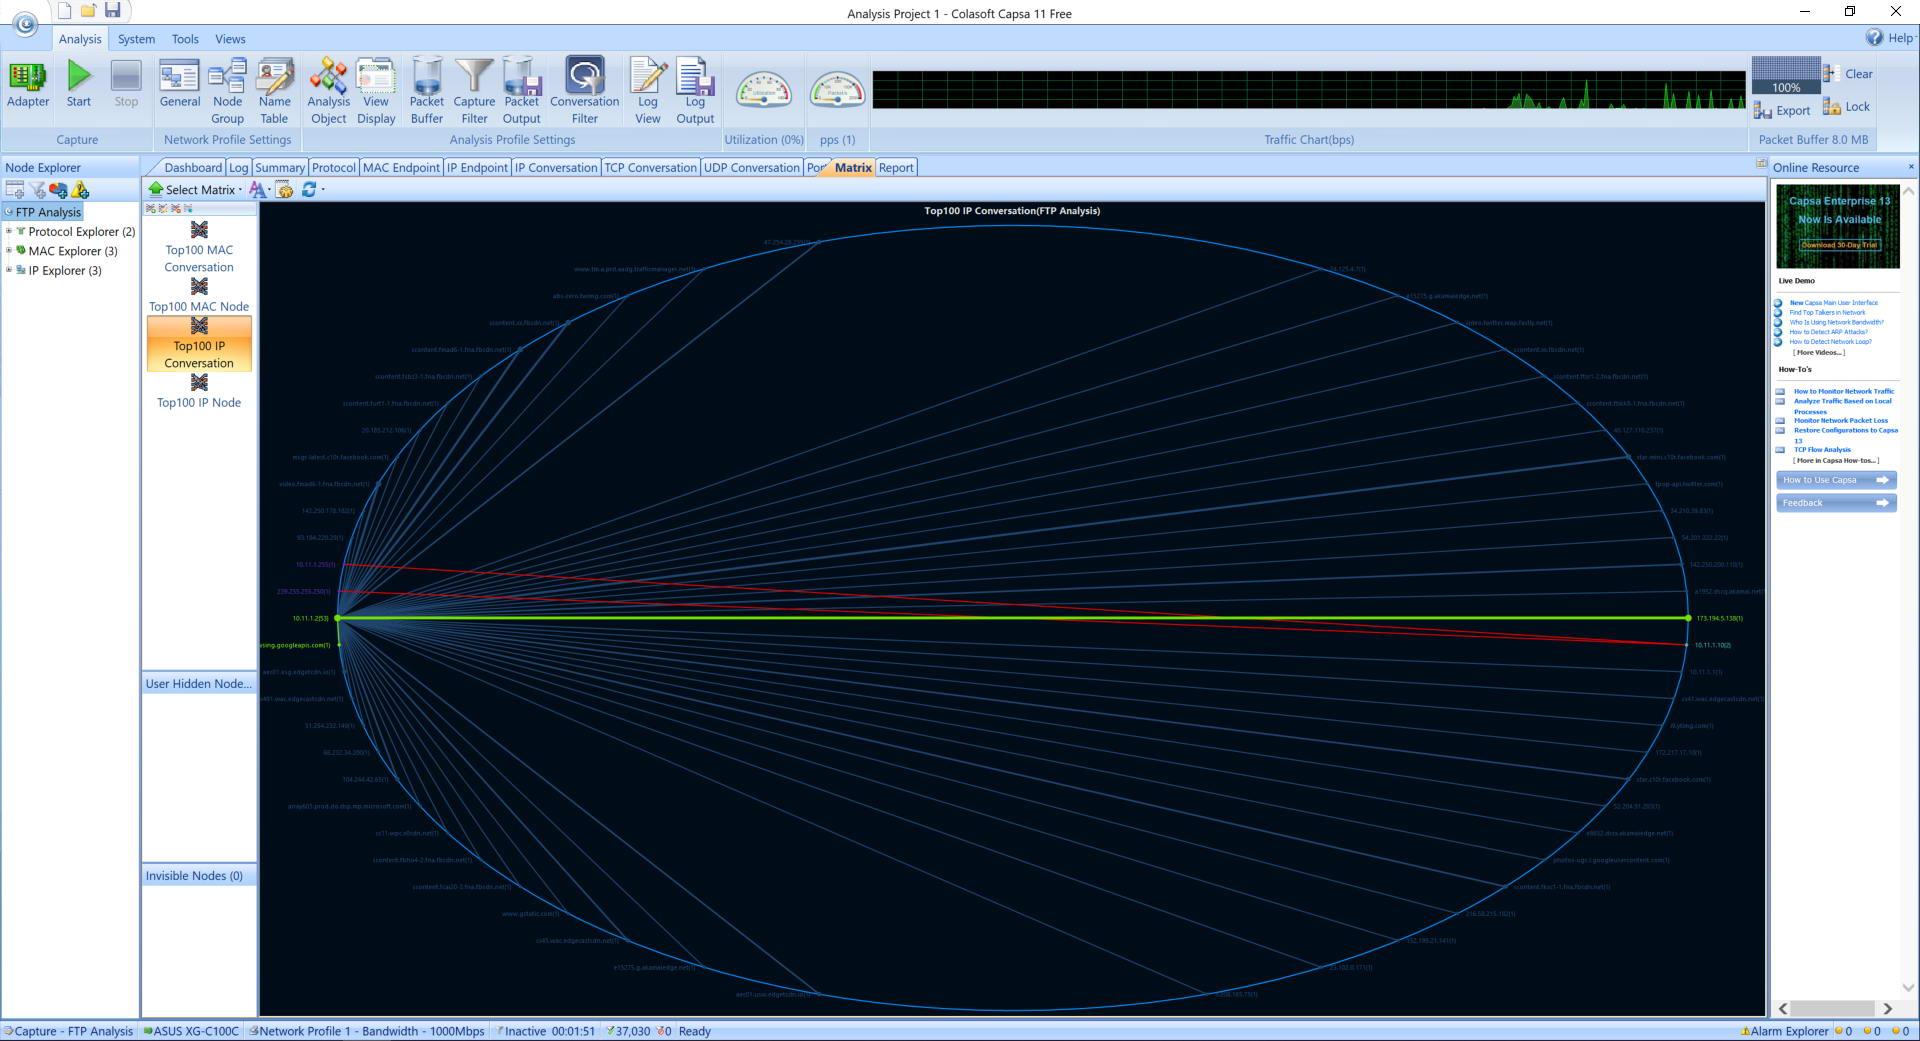
Next, in the «Matrix» section we can see a graph of all the traffic carried out.
Finally, in the section on the left, we can filter by different protocols, IP and MAC, in order to search for the FTP connections made.
As you have seen, this software is very easy to use and understand, it will allow us to monitor all our equipment with outgoing and incoming connections easily and quickly. For example, the Wireshark program with its corresponding filters would provide us with the same information, but with this program we will have everything classified so that we do not have to use these advanced filters that Wireshark has.