As of December 31 and according to Backblaze, the company had a whopping 2,200 SSDs to its credit, so after a time as prudent as several years of use, they have decided that it is time to offer what we are going to see next, which As a curiosity, there are very striking data.
Annual failure rate from 2019 to 2021
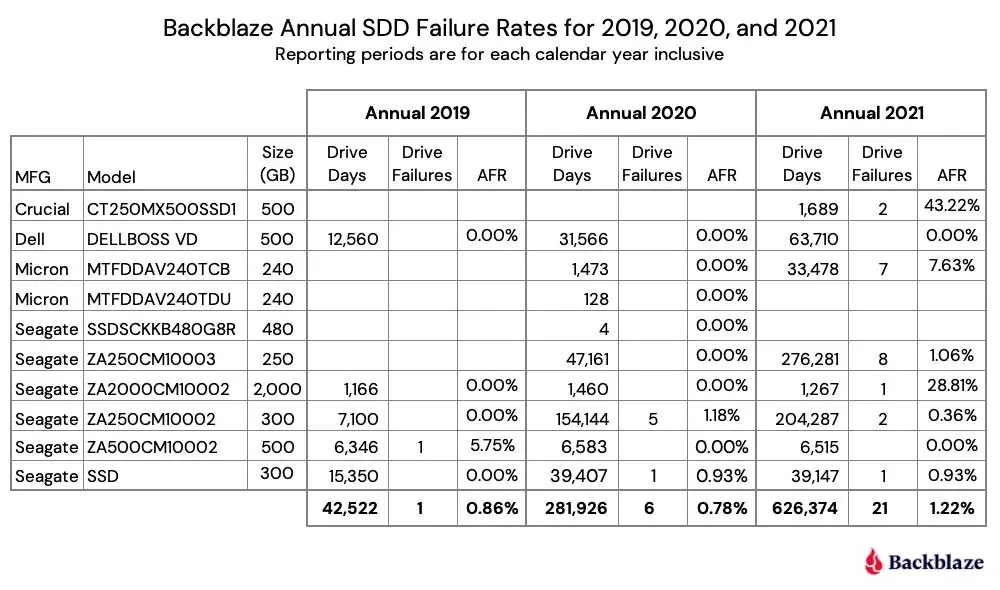
Here there are data that we have to explain because they can be misinterpreted and later we will see them in detail. What we must understand is that year after year the number of annual failures (AFR) increases from 0.86% to 1.22%. Here we must ignore the 43.22% and 28.81% because the number of units is very low and they have very few days of use.
This is due to a very curious effect that is repeated in both SSDs and HDDs: the highest number of failures occur at the beginning of the product’s useful life. That said, the AFR is calculated using the following formula:
AFR = (drive failures / (drive days / 365)) X 100
Therefore, and knowing this, it will be easier for us to understand the following section.
Annual SSD failure rate in 2021 alone
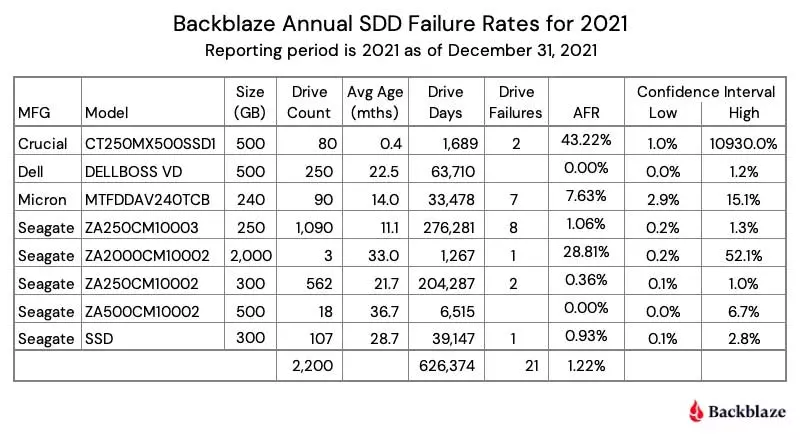
This table is especially interesting because first of all we can see the failures for the newer drives as well as for the older ones. Crucial’s SSD has such a high AFR because it only has 80 drives available with less than a month of use where 2 drives have failed, hence its high value. The same happens in the Seagate, although these only have 3 units, but with 33 months of use, only 1 has failed.
The important thing here is to look at the reliability values and intervals, where Backblaze states that everything below 2% is acceptable and if it were below 1% it would be very good. Here you have to count the number of units available, because the lower the value, the worse the interval.
Quarterly vs Cumulative
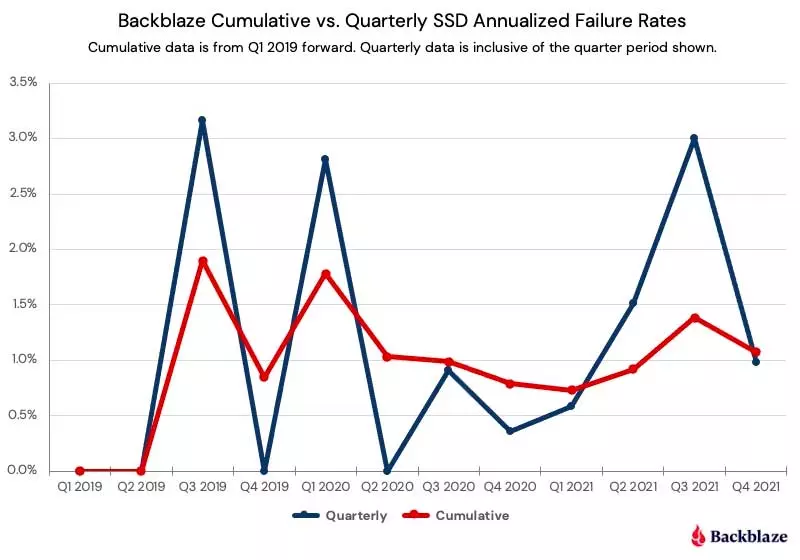
Here the data is taken in another way according to the AFR that we have seen. The quarterly ones reveal very abrupt peaks and show when more units failed on time, the cumulative ones, on the other hand, are more accurate over time, since they reflect longer lasting and equally interesting changes.
This is used to see the failure peaks at certain times compared to the total time, where the value is still below that 2% that we mentioned.
How do older SSDs behave?
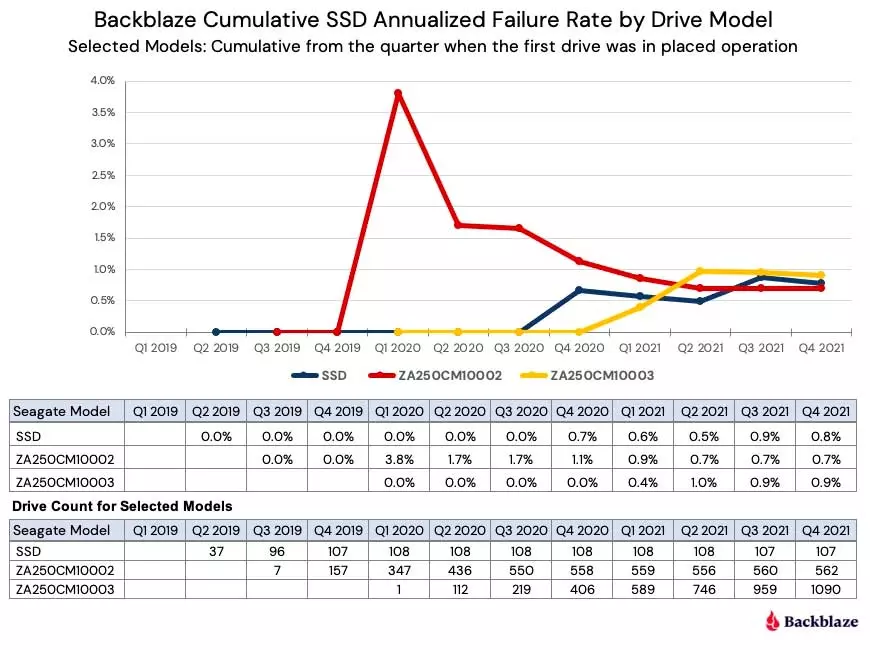
Here we have more curious data that reflects something that we had commented before: SSDs usually fail at a certain point close to their first use and from there they stabilize in terms of failures. In other words, those that fail do so at the beginning and those that endure do so without major problems during their useful life.
The interesting thing about this graph is to see how the AFR fluctuates over time and as units are added to the servers. As can be seen, it is after a year or a month approximately that the SSDs fail the most, and then gradually stabilize. Likewise, the values always tend to be equal to or less than 1%, so we really speak of a very high reliability in almost all cases.