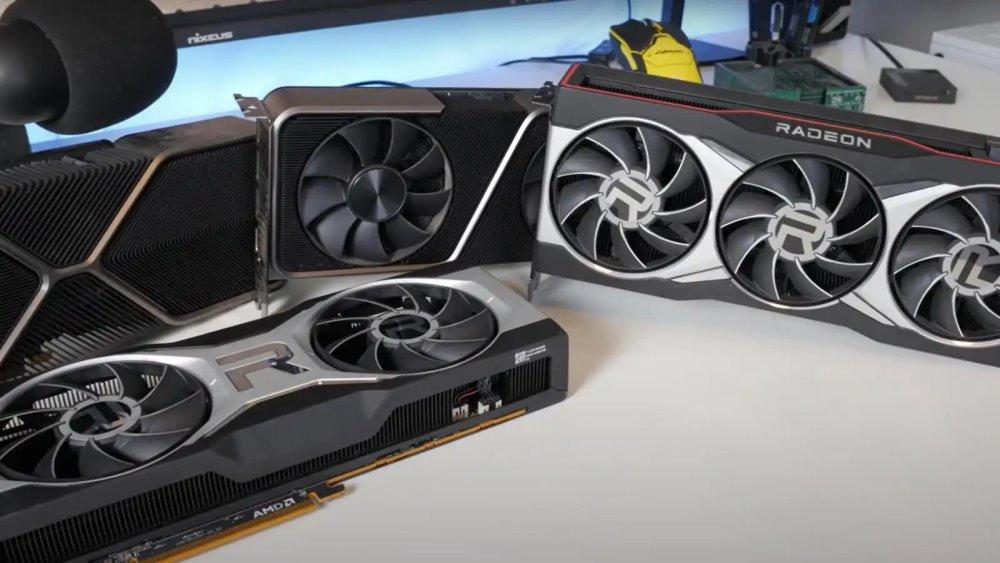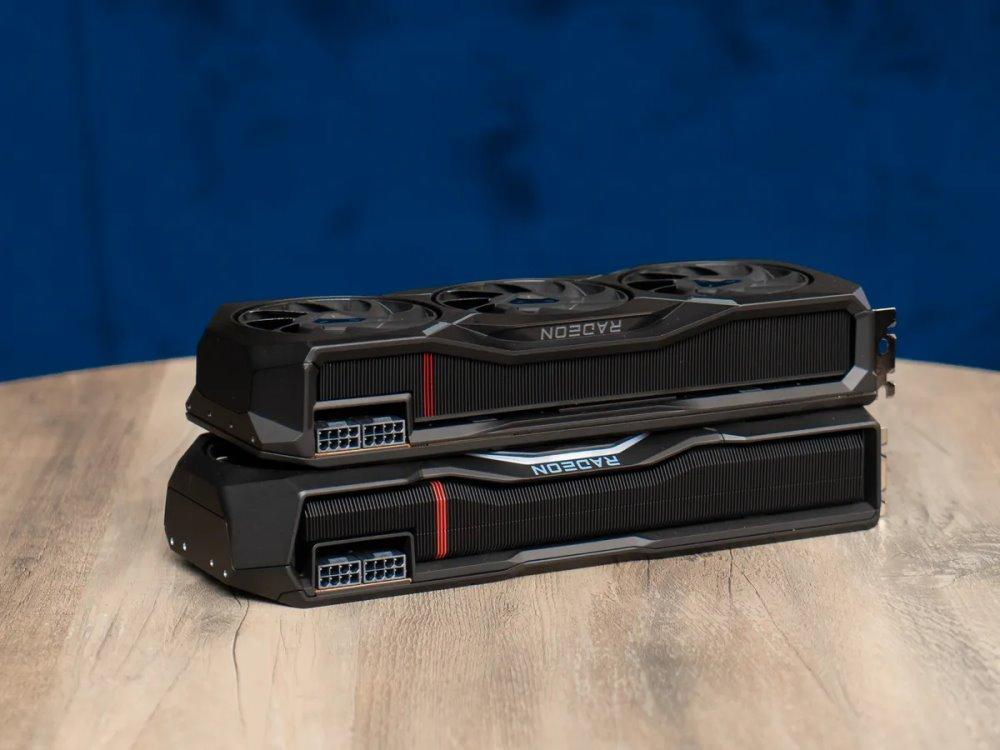
We really wanted to see if graphics cards are becoming more efficient or not. For this comparison we have used data from PassMark, which shows us a weighted average of results uploaded by users.
On the other hand, we have used the TDP (Thermal Design Power) data. This value is not exactly the consumption, but it is the closest that NVIDIA and AMD give. Then, the actual consumption will vary depending on the assembler (ASUS, Gigabyte, EVGA, PowerColor, etc).
Data and model selection
Seeking to make everything as uniform as possible, we have taken the data offered by PassMark. Specifically, we have chosen the average score among all the results that the users with these graphics cards They have risen. We have also taken the average FPS under the API DirectX 12.
Note that PassMark does not indicate the resolution of the average FPS it displays. We understand that for the entry range it is data in 1080p resolution and for the high range it is data in 4K resolution.
We have not only wanted compare he performance per watt and the watts consumed per FPS of the latest generations of graphics cards. The truth is, it is not objective to compare AMD and NVIDIA, but rather to compare the different generations of AMD graphics cards on the one hand and those of NVIDIA on the other.
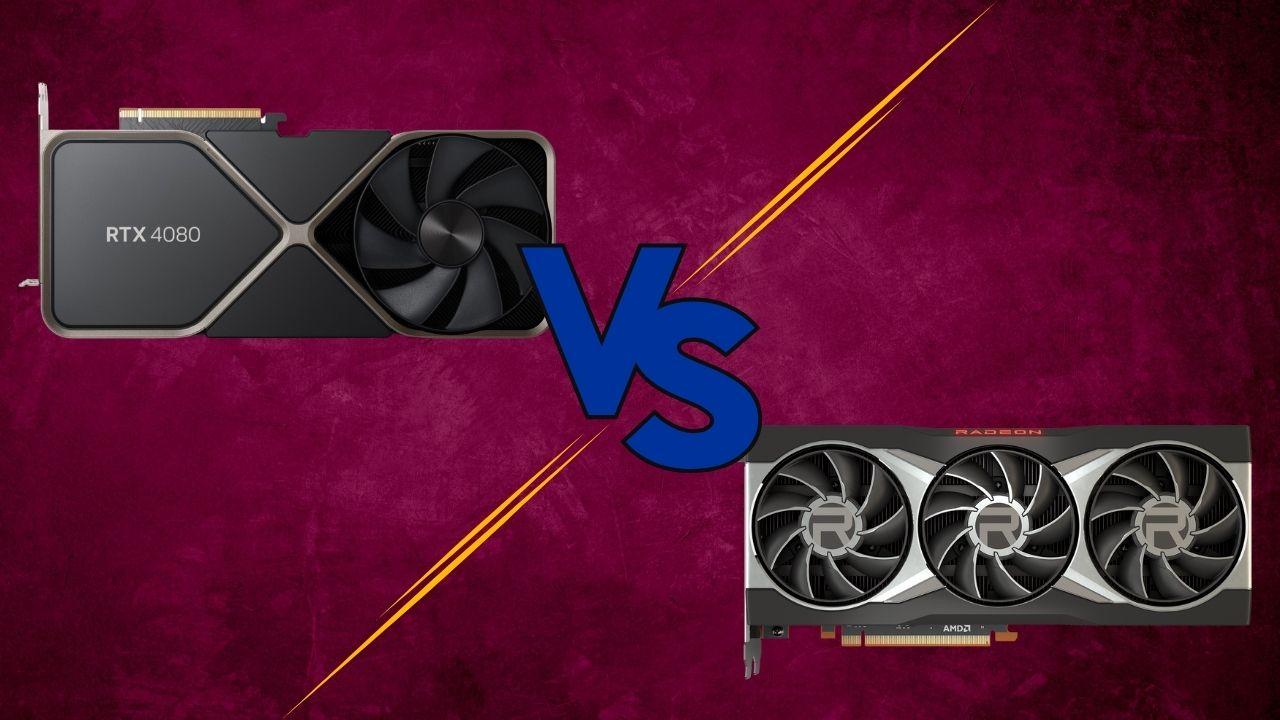
For the comparison we have chosen the NVIDIA RTX 2060, RTX 3060 and RTX 4060, as well as the RTX 2080, RTX 3080 and RTX 4080. Regarding AMD solutions, we have chosen the RX 5600, RX 6600 and RX 7600, while in In the high range we have chosen the RX 6900 XT and RX 7900 XT. You will not see the RX 5900 XT since it does not exist, it has never been released.
The primary objective is to see how the different architectures have evolved and their efficiency. We are not looking for a comparison between AMD or NVIDIA, although you can do it.
Better than expected data for NVIDIA
We emphasize again that all this data is from PassMark, seeking uniformity. So all the data that we will show comes from said website and you can consult it.
The first thing is that in the entry range there is a significant decrease in TDP while performance increases. We can see in the table (at the end of these lines) that the RTX 4060 consumes half as many watts per FPS as the RTX 2060 in 1080p resolution.
| RTX 2060 | RTX 3060 | RTX 4060 | RTX 2080 | RTX 3080 | RTX 4080 | |
|---|---|---|---|---|---|---|
| PassMark Result | 14,116 points | 17,117 points | 19,469 points | 18,801 points | 25,364 points | 34,727 points |
| FPS (DX12) | 52FPS | 69FPS | 74FPS | 72FPS | 100FPS | 127FPS |
| TDP | 160W | 170W | 115W | 250W | 350W | 320W |
| Average points/TDP | 88.2 points/W | 100.7 points/W | 169.3 points/W | 75.2 points/W | 72.5 points/W | 108.5 points/W |
| Average W/FPS | 3.07W/FPS | 2.46W/FPS | 1.55W/FPS | 3.47W/FPS | 3.5W/FPS | 2.52W/FPS |
The RTX 3080 draws our attention in the high range, which is less efficient than the RTX 2080. But, the RTX 4080 achieves a big jump in efficiency with respect to the previous two of 1 watt per FPS.
Taking the data globally, we see that the RTX 40 Series are much more efficient than the RTX 30 Series. In addition, they are also more efficient than the RTX 20 Series, although in the high range they have a larger TDP.
Surprising bad data from AMD
We had the problem that in the first generation of AMD RDNA architecture graphics cards, an RX 5900 XT was not released. So we are left with an empty space, being able to compare only two generations of the same “denomination.” Despite this, the data is quite revealing.
We quickly review that the RX 5000 Series are the first to use the new RDNA architecture. They follow the RX 6000 Series which uses RDNA 2 and then the current RX 7000 Series which is based on RDNA 3.
| RX5600 | RX6600 | RX7600 | RX 6900 XT | RX 7900 XT | |
|---|---|---|---|---|---|
| PassMark Result | 11,471 points | 15,150 points | 16,566 points | 26,954 points | 28,908 points |
| FPS (DX12) | 44FPS | 51FPS | 52FPS | 115FPS | 97FPS |
| TDP | 150W | 132W | 165W | 300W | 315W |
| Average points/TDP | 76.47 points/W | 114.77 points/W | 100.4 points/W | 89.85 points/W | 91.77 points/W |
| Average W/FPS | 3.41W/FPS | 2.59W/FPS | 3.17W/FPS | 2.61W/FPS | 3.25W/FPS |
Within the entry range we see that the RX 6600 are much more efficient than the RX 5600. What surprises us is that the RX 7600 are worse than the RX 6600. We are surprised that the new generation of AMD graphics consumes 22% more than the previous one by FPS.
But this also happens in the high range. We see how the RX 7900 XT consumes 25% more than the RX 6900 XT per watt. We do not know the reason for the increase in consumption, when the manufacturing process is better. RDNA 2 is manufactured on TSMC’s 7nm node and RDNA 3 on TSMC’s 5nm node.
Conclusion
We were quite taken aback by AMD’s results, as we thought they would be better. Their RX 7000 Series seem to be no longer less efficient than the RTX 4000 Series, but worse than the RX 6000 Series. What’s more, the RTX 4060 consumes 50% less per FPS than the RX 7600, which is a huge difference.
