What is RivaTuner
RivaTuner is a program designed to show them, on a layer above the game, the hardware status from our computer while we play. Thanks to it, we will be able to control the status of the CPU at all times, the used and free RAM memory, or the use of the graphics card, among other things. In addition, it is also possible to control the temperature of all computer components in real time, which can help us detect possible problems while we play.
Some of the specific features of this program are:
- Compatible with DirectX, OpenGL and VULKAN games.
- Allows you to record the game in high quality video.
- Fully customizable.
- Function to limit FPS and avoid resource expenditure.
- Very low resource expenditure.
The main problem with this tool is that, if we have not worked with it before, it can be complicated to configure and start up. Next, we are going to see how to start this tool without headaches.
Previous requirements
The first thing to do is download the latest version of RTSS, or RivaTuner Statistics Server. This program is totally free, and we can download it directly from the Guru3D website.
In addition, for the program to be able to show us the information, it is necessary to have hardware monitoring software. For instance, MSI Afterburner, which we can download from the MSI page. Originally, RTSS used its own program, RivaTuner, to obtain the data. But, after its discontinuation, everything has been left in the hands of MSI software, or other similar ones, such as HiS iTurbo or EVGA Precission.
Once we have the previous programs, we install them on the computer to make them ready to start configuring the program. In addition, we must also make sure that we have Windows 10 updated, with administrator permissions, the graphics card drivers installed and that our GPU is compatible with the technologies that we have mentioned, that is, DirectX, Vulkan or OpenGL.
How to customize the data we see when playing with RivaTuner
What we are going to do is configure Afterburner so that it is in charge of monitoring the status of the hardware. In this way, you can send the information to RivaTuner so that the latter will show it to us on the screen while we play.
Prepare MSI Afterburner
Afterburner is an advanced tool used, above all, by those users who overclock the graphics card to get the most out of it. We are not going to go into the subject of OC, so we do not have to worry in this regard.
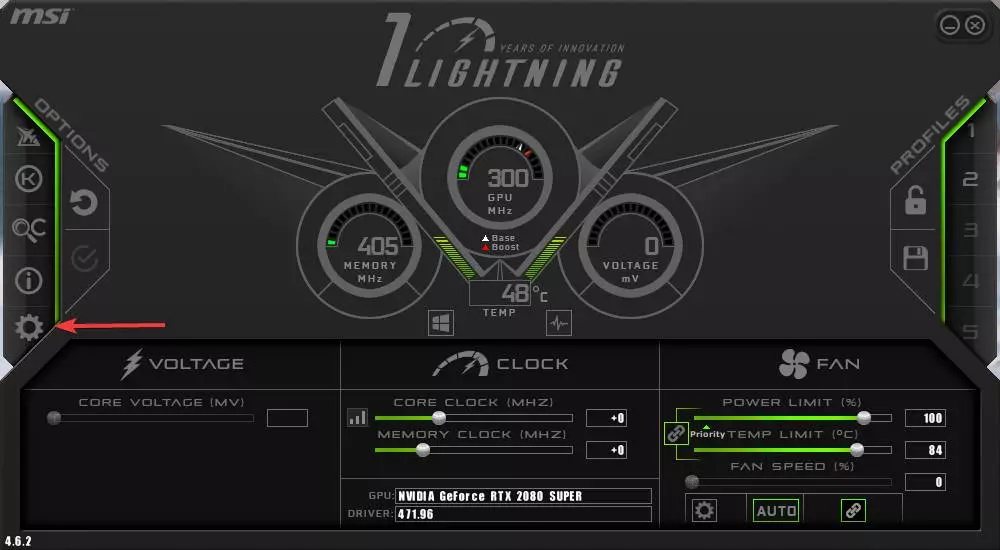
What we must do in the first place is to open the program, and enter the configuration section. To do this, we simply have to click on the wheel icon, although depending on the skin we use in this program it may be elsewhere.
Within the configuration options, the tab that interests us in our case is “Monitoring”. We select it and we can see a configuration page like the one below.
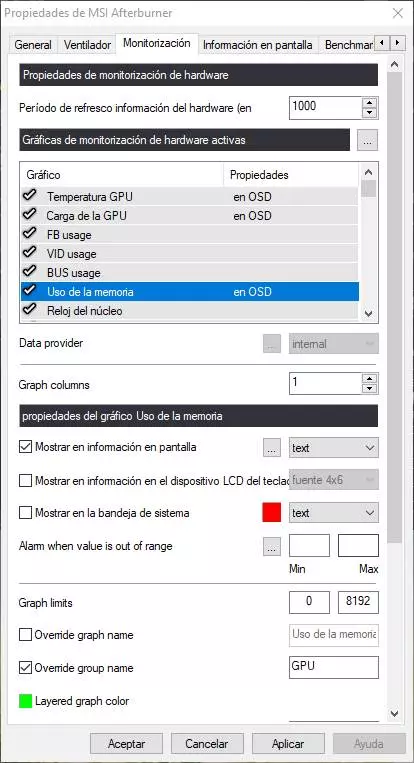
The first thing we are going to look at is in the section on «Monitoring charts«. In this section we are going to have to select all the data that we want to see on the screen. In our case, we are interested in seeing the following when playing:
- GPU temperature.
- GPU loading.
- Memory usage.
- CPU temperature.
- CPU usage.
- RAM usage.
- Frame rate.
- Frametime.
We can select all the elements we want. Once one has been selected (we must then repeat the process for everyone) we must check the box “Show on screen information” so that said measure is shown on the screen while we play. We can choose if we want to see it only in text mode, or if we also want to see a graph with a history.
If we click on the button with ellipsis we will be able to customize the representation of the data in detail.
In addition to configuring the values of the limits, we will also be able to assign a group name. This is used so that all the measures that have the same name appear together in the representation. For example, we can assign GPU to the temperature and use of the graph so that the two data appear together in the same group.
Once all the measures we want have been activated, and the measures configured to our liking, we apply the changes and that’s it. We don’t have to do anything else in Afterburner anymore. Of course, it is necessary to have this program open, in the background, while we play in order to see the data.
Configure RTSS
We have already set up the Afterburner monitoring tool. Now, what we have to do is configure RivaTuner to show us this information. With the Afterburner open, we also run RivaTuner and we can see a window like the one below.
We are going to see the different options that this program offers us:
- Start with Windows: allows us to configure the program to start automatically with Windows.
- Show on-screen display: Activate the OSD with performance data.
- Application detection level: the automatic detection level for games.
- Stealth mode: Activate a stealth mode to avoid being detected by anti-cheat programs. Although it may fail.
- Custom Direct3D support– Activates a standalone Direct3D driver.
- Framerate limit: allows us to limit the maximum FPS when playing.
- Scanline sync– A function to manually sync frames and not rely on V-Sync.
- On-Screen Displaysupport: Activates the OSD display.
- On-Screen Display rendering mode: allows us to choose the type of rendering we want to use in the program.
- On-Screen Display coordinate space: Allows you to coordinate with some games so that the OSD does not cover some elements of the game, such as the action panel.
- On-Screen Display shadow: render a shadow under the data.
- On-Screen Display fill– Fill the background with a transparent or solid color to better read the data.
- On-Screen Display palette: OSD color palette.
- On-Screen Display zoom: OSD size.
- Show own statistics: allows you to choose if we want it to show its own statistics instead of those collected by Afterburner.
Finally, in the box at the end we will be able to place where we want the information that we obtain while we play to appear.
Now let’s create a profile for RTSS and configure it to our liking.
Create a profile and assign a keyboard shortcut
RTSS allows us to create several different profiles. In this way, we can have different profiles for each of the games that we are going to play. We simply have to click on the «Add» button, link an executable .exe and configure this profile as we want. By default, in the central left part we will see a profile created called «Global«. This is the one that will be used by default when there are no more profiles created for specific programs.
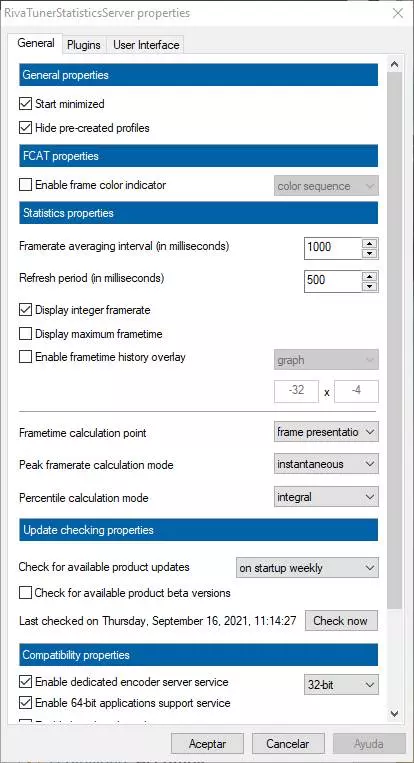
If we click on the button «Setup» that appears at the bottom we can enter the specific configuration of the program.
We can see here different interesting configuration options, such as if we want the program to run minimized, or if we want to show the profiles created by default by the program. We can also configure the display of statistics and some compatibility options. Normally, from the “General” tab we will not have to configure much. The section that really interests us is «Plugins«.
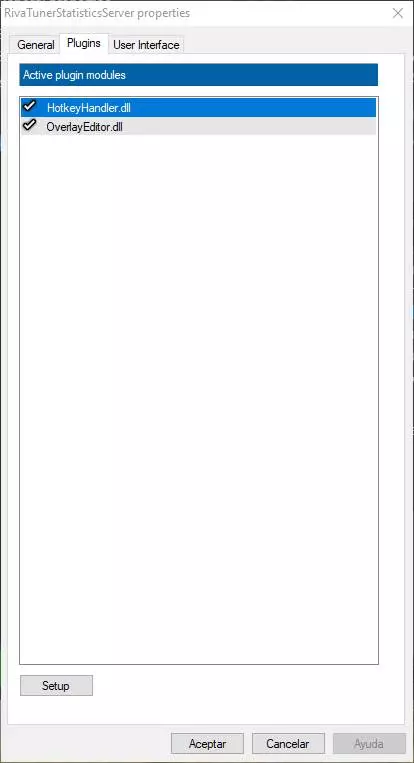
Here we will be able to see all the plugins that we have installed in RivaTuner, and activate or deactivate them as we want. The one that really interests us is «Hotkey handler«. Thanks to it we will be able to assign a direct access with which we can show, or hide, the OSD with the PC performance information.
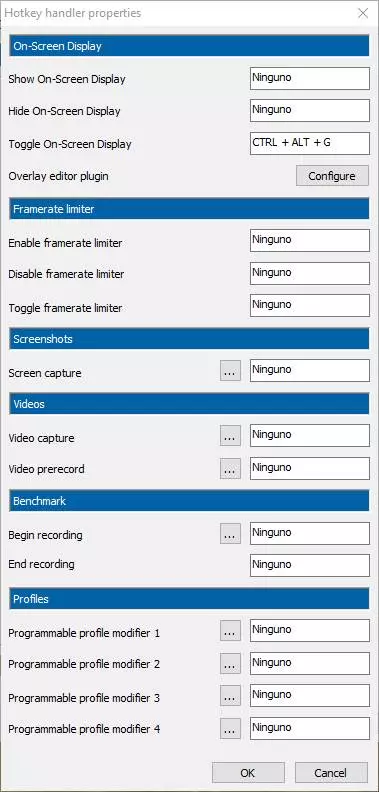
We will also be able to configure many other keyboard shortcuts to take advantage of the functions that this program offers us, such as the limitation of FPS, recordings, profiles, etc.
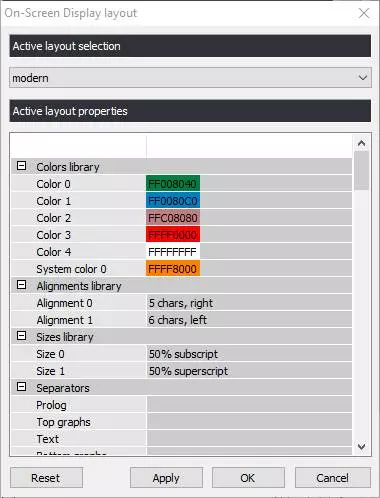
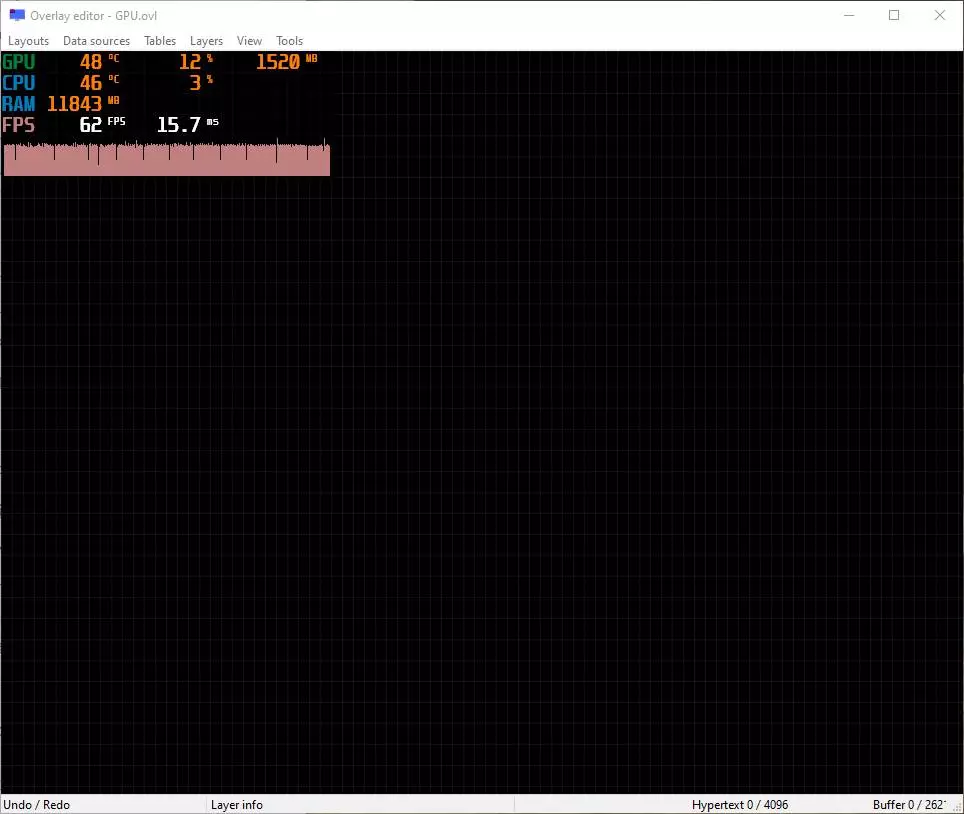
The other plugin that appears, «Overlay Editor«, Will allow us to shape the OSD so that the data is represented as we want. A very useful way to see how our OSD is configured without having to open any games.
We have everything ready to start monitoring PC performance while we play. We open a game, press the corresponding keyboard shortcut and control the temperature, the use of CPU, RAM and GPU and the PC’s FPS.